Day 233: Coronavirus modeling – Part 6

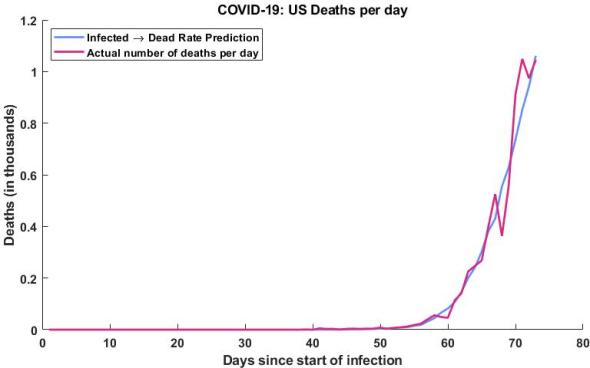
Model estimated death rate plotted in blue compared to the actual death rate plotted in purple. The model predicts deaths based on the previous infected datapoint, so it’s only predicting 1 day ahead, which is not very helpful. However, it lets me check that my model is running correctly.
Another day another unfortunate datapoint for my model validation. On one hand it’s good to be able to further validate my model, on the other, it’s heartbreaking to see it coming to pass. My model prediction isn’t pretty and the trend so far has been very similar to the model. Let’s talk about how we validate the model.


