How to process EEG data
For those just tuning in, I’ve been busy! I made my deadline, barely. Unfortunately that was one of two. The second requires me to have all the work done, not just part of it. I managed to finish one of ten (yes ten) of the datasets I had, so now I have less than two weeks to finish the rest of it Let’s take it from the top and discuss how we process EEG data!
Most of the data processing is quick, I can finish ~90% of the data processing by script and just walk away from it while it takes its sweet time to finish. Even with my super (nice) computer it takes ~ a day to process one dataset. Unfortunately when we record EEG the amplitude of neural signals is in the order of microvolts, or as I like to put it super freaking tiny. Which is why there’s so much work to do.
Our lab follows a modified Makoto’s pipeline. Loosely put, we high pass filter at ~0.1 Hz to remove any drift. That comes from movement of the sensor on the scalp or light tugging on the wires that connect the sensor to the amplifiers. That’s step one and it’s easy and fast! We also re-reference our data to the common average to make sure it’s all centered around zero, which is also fast and easy to do!
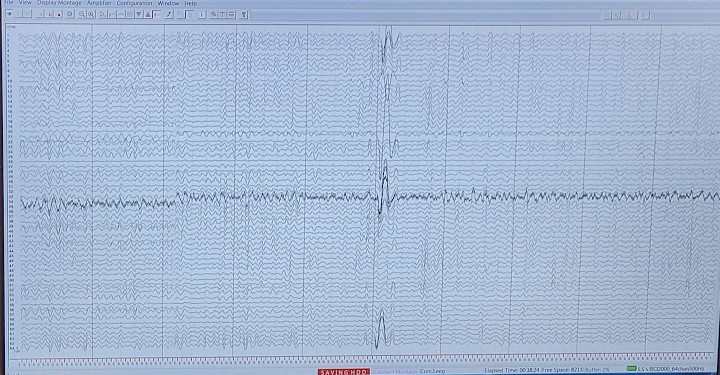
Next we need to filter out our eye movement/blink artifacts. See your eyes are like little batteries they have a charge so if you move your eyes side to side, up or down, or even just blink we’ll see it in the data. In fact, the artifact from this is so pronounced that we use it to verify that our system is recording properly (see the top photo) since we can’t make sense of the neural activity in the raw form.
To filter this we place sensors around the eyes and use H-infinity to remove the eye artifacts. H-infinity is an adaptive filter, you give it an example of the artifact (the sensors around the eyes) and it will remove that artifact from the data. It’s basically magic, but it’s magic that is slow and eats up a lot of computer resources.
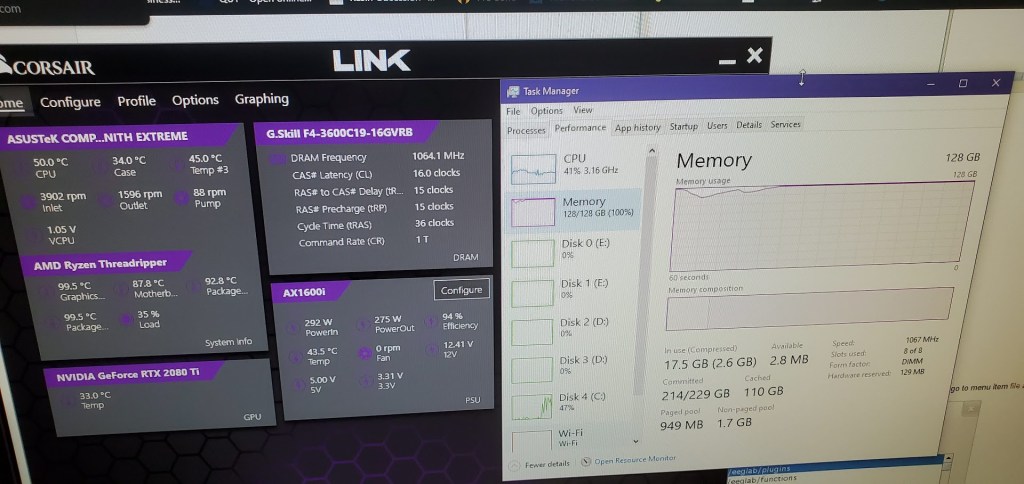
I recently went from 64 Gb of ram to 128 Gb to accommodate the filter. We run it using a matlab parfor loop, which creates a parallel pool and runs the data through at the same time, so it basically moves all the data to the ram, copies it once for each parallel worker (in my case 64 times) and then does its thing. I was worried it was a vanity purchase and that I didn’t need the full amount of ram. Well the other day I ran it and let’s just say it wasn’t a vanity purchase after all. I took a photo of the ram usage (yes a photo and not a screenshot because well look at the usage) and while the dataset itself is ~1-2Gb there’s a lot of computations happening in the background obviously.
The more parallel workers I give it the faster this step goes, but I also need to be cognizant of the ram requirements or the computer will kick out a worker from the pool, try to rerun the entire thing with the reduced number of works, then inevitably fail because the number of expected workers doesn’t match the number of actual workers. Also notice my computer is running at a chilly 50 degrees celsius under high load thanks to my new watercooler instead of the 81 degrees it was running with the old broken (probably clogged) one.
Then we use artifact subspace reconstruction (ASR) to remove other sources of interference, this can be from line noise (although minimally removed, we have another step specifically for this), sensor movement, EMG artifacts from the muscles of the scalp, things like that. I won’t go into how it does this, but it looks for a “clean” portion of data, adjusts the thresholds accordingly then cleans the data. One day I’ll do a seperate high overview of how it works without getting into the math behind it. Not today though this is already getting long!
And that’s it! Well not really, that’s just the steps I can run without having to be involved. The next steps require me to be the one making the adjustments. Namely we compute the dipoles and independent components then perform independent component analysis (ICA). You can think of a dipole like a magnet, one side is positive the other is negative. In your brain, when groups of neurons fire you create a dipole, one side is positive the other is negative and we can use the sensors to estimate where this dipole is located in the brain with a fair amount of accuracy. We use this information to help guide our ICA.
ICA breaks the EEG signal into independent components (hence the name). I’ll make a longer post about this eventually, but for now let’s just go over the basics. Every signal we record is a mixture of signals so ICA attempts to separate these into individual components. You get one IC per channel, so since I have 60 channels the program returns 60 IC’s and I have to manually go through and select which ones I keep and which ones I toss. Afterwards the new clean signal is reconstructed and no matter how many IC’s you have, you get the same number of channels (sensors) back that you started with, just without the IC’s you determined to be noise or non-cortical artifacts.
When we do ICA we need to look at the raw data itself to see if we can identify some of the artifacts. When I first started in the lab this looked like magic to me. Now it’s just a pattern recognition thing really. If you’re getting into EEG data processing and stumbled across this post because you’re confused with ICA, try this website out. It’s a little “game” that lets you try to figure out what the independent components are.
There’s no real “right” answers. Sometimes the answer is more obvious than others and when you make your guess, you get to see three or four “experts” give their opinion on what the IC was. You’ll notice that on some it’s very obvious and they all agree, on others you get no consensus at all. Really all you need to be able to do is identify neural activity from non-neural activity. Knowing that the IC was caused by EMG for example doesn’t do anything for the analysis except help inform you that you need to remove it. This step takes FOREVER! It takes me 3+ hours of tediously sitting in front of the computer and focusing on the analysis in order to get it done for a single dataset and I have ten!
Once I’m done with that, then all I need to do is segment my dataset. Now I use “flags” thrown into the data to tell me which sections of the data are things I’m interested in. We record continuous datasets, which may have several different conditions in them. So I use these flags to tell me which chunks to remove for my analysis (I literally call them chunks in my code, lol). This assumes that I threw in the flag correctly and didn’t double flag, which if that’s the case then I need to edit the flag position or remove a double flag. That’s not super difficult, but it does take time. If I have repeated conditions (which we usually do) then I can average or do my analysis then average, it’s all a matter of what I’m doing with the data.
Right now I’m still doing ICA for a lot of my data. I finished one dataset completely and did my analysis (thankfully the analysis part is fairly quick). So now I need to finish with the other nine. It’s going to be close (as usual), but if I can get all my data processed in the next few days I should be able to make it with time to spare. Assuming I can focus on just that and nothing else comes up.
With that semi-short intro into the world of EEG cleaning, I need to get back to work. So much data!!!


But enough about us, what about you?