Flexible coding for data visualization

My main-PI has an odd habit of wanting us to edit things as we’re presenting them. I’ve watched this happen and had to do it myself. Suddenly you find yourself editing a paper/grant/etc. and forgetting how to spell your name because you’re so flustered. It isn’t just papers though, it’s our visualizations that we make. He will ask us to go in and change things as they are being shown. This has happened to me several times already and more often than not I’m ready for it. So today I figured I would go over some of the things I do to make sure that I don’t spend the entire time sweating over edits to my code.
I started my career in academia as a mechanical engineer, where I got my BS and MS. There wasn’t a whole lot of data to visualize. My work was focused more on design and design principles so I spent more time talking biology and making cool 3D models for visuals than I did working on code. When I transitioned to my PhD things changed dramatically. Neuroengineering has a lot of data visualization components and it’s important to do it well. Which means I had to brush off my MATLAB skills and attempt to do something other than control systems (which was the focus of my BS). I figure I’m not the first, nor the last, to make a transition like that and it may be useful for anyone reading to go over some of the things I’ve learned so you don’t make the same painful mistakes I did.
Every week for the past 5 weeks I’ve been presenting to the lab the work I’m doing (more). There’s a lot of edits that go into this because like I said my main-PI loves to make these changes live while we’re talking about them. Not all things can be changed so quickly, but when I code I make sure that a lot of the details that go into a plot are easily adjusted. So when last week for example my main-PI asked me to make several changes to my plot right there on the spot I adjusted two things in my code and it spit out the new updated plot in less than a minute. It doesn’t take magic, it just takes a little planning.
The first piece of advice I can offer is that variables are your friends. And just like friends, you want to have a lot of variables (okay maybe you don’t want a lot of friends, but trust me variables are a good thing). Having variables up front and easily adjusted will make you look like a coding wizard when really you’re just a good planner and don’t want anyone to see your awful code. I’m not a great coder, I know this, I can live with this, but my code is flexible and that looks like magic to anyone not reviewing it line by line.
Now this is a MATLAB thing in particular, but when I write my code I have a format I use. First I give a brief description about what the code does, how it works, and anything important I need to know because I WILL forget about if I don’t use the code for a hour week. Seriously, my memory is awful, so if I haven’t used the code recently I won’t remember what the heck I was doing in it. For that reason, I’ll list the previous step(s) that need to be run before I use this bit of code as well. Even if you have a great memory, you should probably do something similar.
Next I give a sometimes long list of variables that can be changed depending on what I want the code to do. Let’s go over this last bit of code I wrote to help you understand what I mean. The code was something I whipped up to produce a plot that averaged all my trials, but it also plotted each individual trial above like a list with the average at the bottom. It was all hand written, I tried finding plugins or other code written that would do the job, but no luck. The thing was there’s a lot that you can do with these plots so I needed (or rather wanted) to make sure that I could adjust quickly and painlessly depending on what I wanted to show.
For example I may want to apply a low-pass filter to my data to make it look more smooth. This is a routine thing we do, but it isn’t something we ALWAYS do. So I made a variable that would switch between the two modes using the string compare function (strncmpi) and I just switch the variable from yes to no as needed. With EEG data we have a lot of sensors to choose from (64 to be exact) and since these plots are for a single sensor I have a quick adjust for that as well, I just need to input the sensor number and the code will do the rest. The sensors are named in the dataset so I wrote a bit of code to pull out the name for the sensor and add it to the plot, again it looks like magic, but it’s just laziness. The less I have to think about my code, the better because there’s less chance I can screw something up.
Of course, there are also plot options like color, line width, title options, even options to plot the every n-th trace so if I had 400 for example if I plotted all of them I would end up with either a black plot because they are all on top of each other or the scale would be so small that they would all look like straight lines. Trust me, I tried it. So I set a manual adjustment for scale, spacing, line width, and made a way to skip traces so I could keep everything looking nice. That last part, that was something my main-PI wanted me to change. I had plotted every 5th repeat and he wanted all of them so in just a single change I managed to remake the plot without any real pause in the discussion.
The code also will throw out reminders for variables that I may forget to set. Like if my data are centered around zero. Sometimes when we make a plot of an event occurring we want to plot a periods pre and post that event. We call the event time t= 0 so the data are technically centered around zero and things need to be adjusted. A line needs to be added at t = 0 so that it makes it easy to see where the onset was, the x-axis is typically time so that needs to be adjusted to account for the time before onset instead of starting at zero. The code will do this for me by changing one variable I called zerocentered from no to yes.
Really all I did was create two plot conditions and use an else statement for the second case. Once again I’m using the string compare function, which let me say is super helpful when I want to have a yes/no option instead of a 1 or 0 option which is less intuitive (to me anyway). I guess I should just show an example to get the point across:
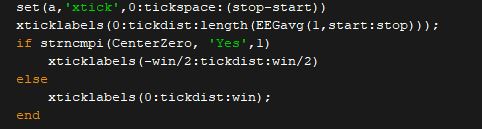
Ignore the variables here for a minute and you’ll notice that there are almost no numbers. Anything that I can adjust I have a variable for, the first line sets my tick spacing (where the numbers go), it starts a zero because it will always no matter what. I can start it somewhere else, but that would be weird for my uses. So it is set 0:tickspace:(stop-start) so that I can adjust how far apart my ticks are, do I want one every 10 ms or every 5? Doesn’t matter I can change it in the first few lines of code while this is burred near the end. Start and stop points are adjustable, but they will effect the last value for my plot so that’s why we have (stop-start) instead of a set value, again it’s flexible.
Tickdist is the actual value that I can change and tickspace will automatically change. tickspace is a function of my sample rate and Tickdist is in milliseconds so if I sampled at 500 Hz that’s 500 samples per second (some division will turn it to milliseconds), so I set my Tick distance in milliseconds and everything updates automatically without my needing to change it. win is in samples not milliseconds, so I made a variable called winsize that is in milliseconds for easy changing.
Okay, so let’s take a quick look at my variable selection

This is just a small sample of my variables that I can change before I hit the run button. Not that a lot of this will make sense to anyone but me. The point of me showing this is not so you can copy it outright, but to give you an idea about why writing your code like this is important. When I quickly needed to make changes to my code, all I had to do was change a few numbers neatly organized and defined at the top of my code. You’ll also notice several little comments reminding me of the units (milliseconds, microvolts, etc.).
The main point is simply if you have the ability to change a variable in your code, you should predefine it at the top to make changing it simpler. This keeps me from having to dig through my code and changing things. Importantly, I can run extra things before plotting (the low-pass filter, variable not shown above) without having to heavily edit the code. This isn’t just a speed thing, this is also a simplicity and flexibility issue. I’m able to do several things with this code without significant changes and that saves me time and keeps me from screwing things up by changing something by mistake.
A quick example before we wrap this up. In the first image I shared I have line of code that says:
xticklables(0:tickdist:win);
This is a MATLAB command that adjusts the labels on the x ticks (hence the name of the function I’m calling). If I rigidly defined this it would look something like
xticklables(0:10:5000);
This would work just fine, it would place a label at 0, 10, 20, …, 5000. So in this example my data was length 5000. Now say I wanted to reuse this code and plot something that was 4999. First this would throw out an error if it did anything at all. Say I also wanted to change my labels because they were actually every 20ms and not 10ms. I would need to go into this code, find this line, change it, and then run the code. That’s not so bad I guess, but it takes time finding this particular line of code. I would also need to remember what this bit of code is doing, and I most importantly this bit is linked to the set(a,’xtick’….) code at the top of the line that would need to be adjusted as things were being adjusted.
The way I wrote the code will update all this automatically without any effort on my end all by changing one (or two if I wanted to adjust tick labels) lines of code. Waaaay easier than trying to hunt through the code to find these particular lines. It’s especially difficult when I have multiple subplots, then I can have several lines of this exact code to adjust each plot individually, by linking it all together I can adjust it once and forget it.
The takeaway is this; by taking the time to make these extra variables as you write your code, you’ll save yourself a ton of headaches later on. Trust me, I used to not write my code like this and I hate going back to reuse some of that code. It’s not flexible, it’s not easily reused, and I have since found better ways.
The best part about this is you don’t have to fall into this hole like I did, now you know.


But enough about us, what about you?