Effects of transcutaneous spinal cord stimulation on the brain
Transcutaneous spinal stimulation (TSS) is a relatively new approach to neuromodulation. We can activate networks in the spinal cord by injecting a small amount of current through the skin, which evokes a response in the muscles (muscle contraction). Depending on the person the electrical stimulus (the zappy time) feels either like a massage or it can be uncomfortable, not exactly painful, just not something you would go out of your way for. But the spinal cord is a two way street, so what does TSS do in the brain?
Three years. Three years is how long it took to finish this project and we’ve finally published the results. It’s been a long, painful journey and the data collection itself, thanks to COVID, lasted almost a year alone (here’s the post where I finished the collection). Then came the data processing, the analysis, the paper writing, etc. The thing about this paper that you need to understand as we talk about it is that EEG records electrical signals from the brain (more here) via electrodes sitting on the scalp. These electrodes are very sensitive, so sensitive that they pick up the 60 Hz (USA) line noise from electrical wiring in the walls. So imagine how badly the data would look if we were to say, apply an electrical current to the spinal cord via TSS.
I had to learn a lot of new skills and come up with a lot of new ways to work with this data. From the beginning it was a challenge and I wrote extensively about how the process was going without talking about the project specifically. I had to learn both the neuroengineering side of things and the neurophysiology side of things to make sense of the data and that took time. In the end, I did it and I also came up with some really interesting ways to showcase the data. With that brief introduction let’s talk about the experiment and what we found.
Transcutaneous spinal stimulation (TSS) needs a lot of current to activate the spinal networks when compared to the invasive version epidural spinal stimulation (ESS). For comparison the average person will need anywhere from 50-100 mA (that’s milliamps) of current to evoke a response (fancy way of saying muscle contraction), while ESS can do it easily with 10x less current and I’ve even seen evoked responses as low as 2-3 mA using ESS. In both cases, roughly the same amount of current is being sent to the spinal cord, it’s just TSS requires you to go through the skin, fat, muscle, etc. to get to the spinal cord while ESS is placed directly in the epidural space so not much separating the electrode from the spinal cord.
The other thing you need to remember is that while ESS is very localized, because of volume conduction, TSS is more broadly applied. You can think of volume conduction as ripples in the water, the further the source is away from a target the more far reaching the ripples get. This means we don’t have the specificity that you can get with ESS, but TSS can activate proximal (close to the body) or distal (far away from the body) muscles and even left or right side semi-preferentially, so we have some selectivity.
TSS is being studied to help restore function in people who have a spinal cord injury or other neurological injury, but we’re always trying to do better and that’s what our study is about. Like I said in the first paragraph the spinal cord is a two way street, so what we’re doing with TSS (or ESS for that matter) is activating dorsal roots (the nerves going into the cord) and that causes muscles to activate, but there is no reason that the effect wouldn’t travel to the brain as well. In fact, we expect it to have some effect on the brain, the question is what?
Small aside, I’m talking a lot about the spinal cord and while I’m trying to be detailed, I also need to keep it semi-brief for sake of the length of the post. If you want to learn more about the spinal cord and all the ways we probe it invasively or non-invasively I have a full series of posts on this (50+ posts I believe), which you can find here.
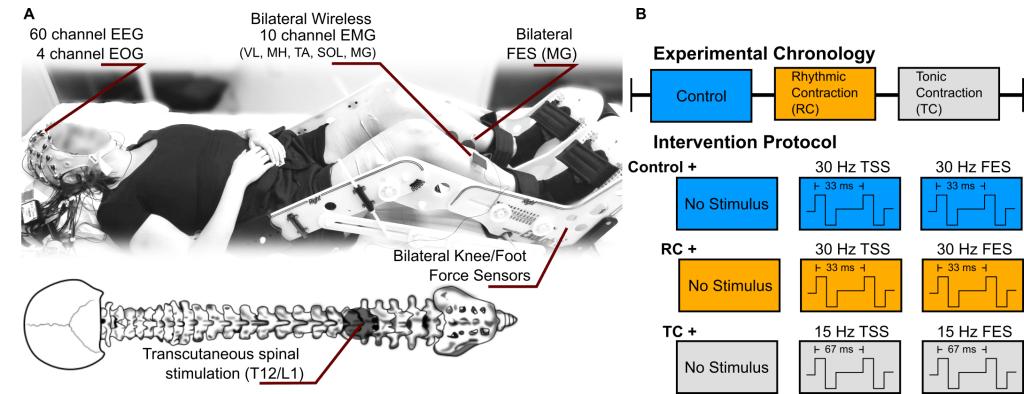
To answer that we recruited five neurologically intact people (COVID issues) to participate in 3 sessions of TSS while recording EEG during the first and last session. This was done over the course of one week and we recorded 64 channels of EEG, 10 channels of EMG, and had a custom made force device made to measure foot and knee forces. A bit of background, TSS is applied at two frequencies (frequency is number of stimuli delivered in one second) depending on the task. For standing, it’s been shown that the best frequency to enable that task is roughly 15 Hz and for rhythmic motions (walking) it’s been shown that 30 Hz works best. Our participant performed one of three tasks, a no movement (rest) task, a rhythmic muscle contraction task, or a tonic muscle contraction task.
For the rest condition we applied either, no stimulus, 30 Hz TSS, or 30 Hz FES (functional electrical stimulation, or electrical current applied over the skin, like TSS, but on a muscle) applied to the calf muscles. This is our control basically to see if the the sensation of stimulation or the electrical artifact could be the cause of anything we found.
For the rhythmic contraction task, which was to simulate walking, we followed the same protocol, no stimulus, 30 Hz TSS, or 30 Hz FES. During the tonic contraction task, which was to simulate standing, we applied either no stimulus, 15 Hz TSS, or 15 Hz FES. Now that’s a lot, but don’t worry, because I made a very fancy graphic explaining the setup, which is shown below (and the header).
Each task was performed for 30 seconds and repeated for eight times with a minimum of 30 seconds between blocks. So 30 seconds performing a task, 30 seconds of resting state, which got confusing for some during the resting state with no stimulus, but we made it work.
There was a TON of fancy coding I had to do to process the and analyze the data, for more information I suggest you check out the paper, but once the data were cleaned we could do the analysis. Some of it was simple (relatively speaking) and some of it took me awhile to get right (to be overly honest). So I clustered the dipoles of the entire group (that post I linked to was literally me working through this data) to find common areas of activation, then I basically stayed in IC space the entire analysis because I felt it was the better way to work with the data. Below shows the IC clusters we got, the number of dipoles for each, and the location of the brain that they are located.
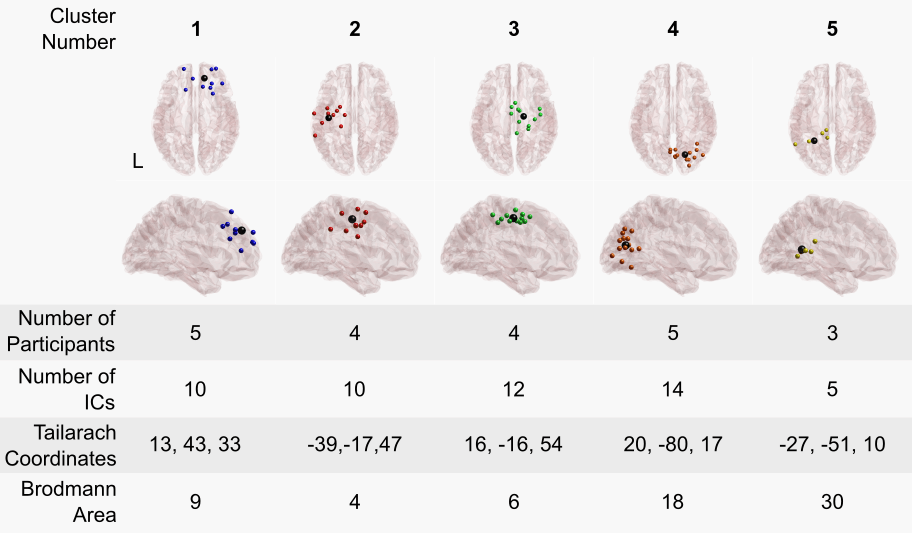
IC space or independent component space, gives me individual signals from the recordings, and made it easier for me to work with the data, we had 5 clusters, so effectively 5 data streams vs. the 60 channels of mixed data. A few things to note, IC space is unitless so everything was scaled to plus or minus 1 since it was arbitrary (this is with regard to figure 7 of the paper specifically). We averaged the response from the stimuli (all 36,000!) and figure 7 shows the results of stimulation on brain activity, we get what’s called an evoked response, where the brain does something in response to the stimuli. You can see that not all conditions (specifically FES) elicited an evoked response. I’m not showing figure 7 here because it’s long, but the paper is open access so take a look!
Now the coolest thing we did with the data came in the form of the functional connectivity analysis. Functional connectivity is a way to measure information flow, used typically in stock market analysis and things like that. We’re only somewhat recently (maybe 10-15 years?) applying these methods to EEG and I used generalized partial directed coherence (gPDC) to determine information flow. I have like 2 pages of all the fancy math that goes into it, but basically we create a model that explains our data, then we use that model to see if information being passed from one or multiple sensors better predicts the output of a target sensor (in my case I did this in IC space, so IC not sensor) the catch is it has to better predict the output than the target sensor information can be used to predict the target sensor. That means that if we have a bridge occur in our EEG data (meaning the gel we use to close the gap between the scalp and the sensor overflows to another sensor causing the connection to be shared) we won’t get a false positive.
Two things to note about gPDC, we can look at information flow from multiple sensors (IC’s in my case) to a single target sensor (IC). You can’t do that with some of the other measures. The other nice thing about gPDC is that it doesn’t just tell us information is flowing between the two sensors, it tells us the direction! So we can know not only how many different sensors (again IC’s) are passing information to a target sensor, but we can also know the direction of that information (since it could be either direction).
Since I was doing this in IC space and not sensor space (EEG sensor data) I wanted to show that difference explicitly in my results. The stuff that my colleagues were using in the lab used what’s called a topolot (here’s an example if you scroll down, it’s the circles) and lines connecting sensors to show the information flow. That brain image I created above showing the dipoles? I figured I would use that to show off a bit and create something one of a kind, a 3D video demonstrating the functional connectivity changes.
Before I show that, I should clarify here. So we have functional connectivity for our trial and all conditions, task + no stim, task + TSS, or task + FES, to find the significant differences I used the task + no stim model and compared it to the task + TSS or the task + FES model to determine what was significant, because just doing the task we would expect information flow, so the difference between task + TSS and task + no stim (for example) would be due to the stimulation since that’s the only thing that changed. This also means we could look for significant decreases or increases, not just significant changes, which is important since stimulation could (in theory) cause both increase and decrease in connectivity.
It turns out that FES didn’t cause any significant changes in functional connectivity for the two conditions (tonic contraction or rhythmic contraction), which was good news for us since stimulation for both TSS and FES was sub-motor threshold so if we had significant changes during FES I would’ve been a little suspicious that something was wrong. However, here’s where it gets cool, we found significant increases and decreases in functional connectivity during TSS for both the tonic and rhythmic contraction tasks! Some frequency bands (because we divide EEG data into band power) had almost 35% difference! That’s a lot, in my opinion anyway.
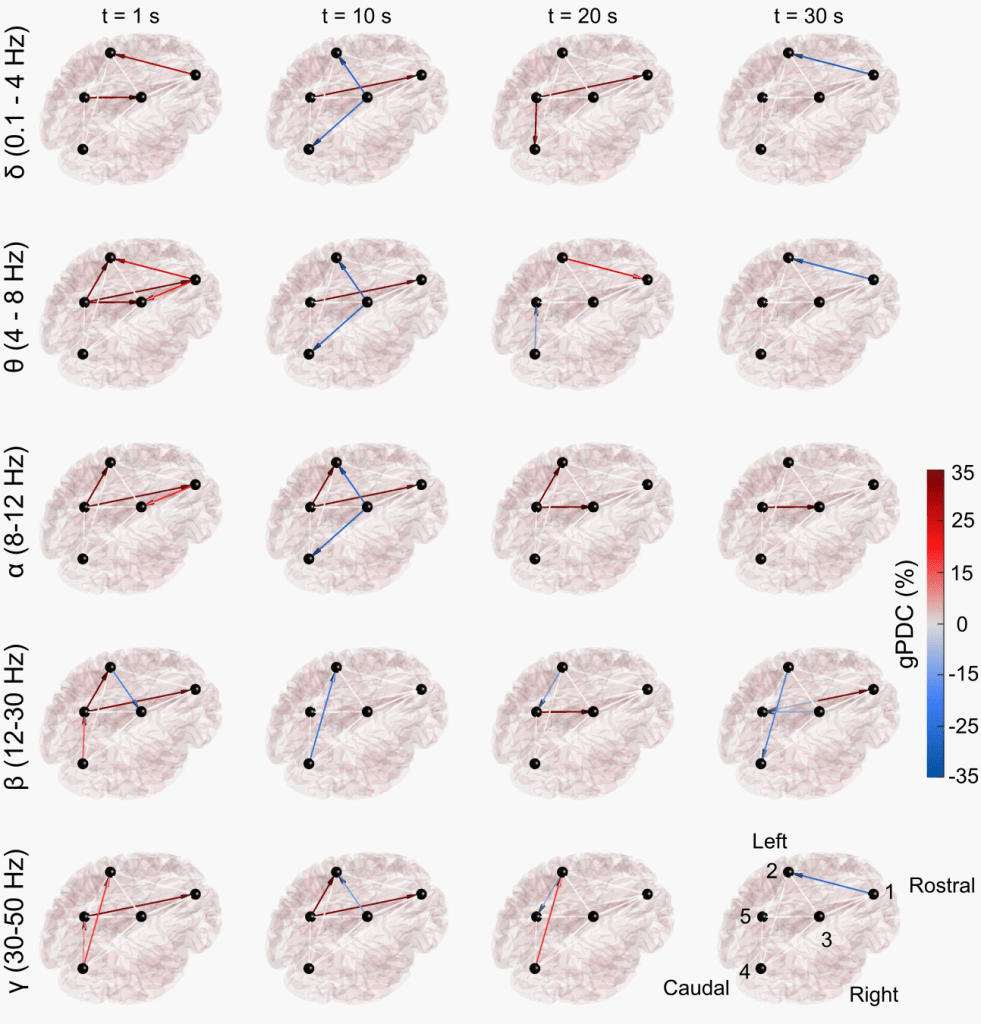
So despite the size, I’m really proud of this figure, so here’s an example of our findings in image form with my fancy 3D brain model (again one of a kind and custom written code, because I’m so proud of how cool this came out and how much effort I put into it).
Three years. Wow.
The important thing here is that this establishes a baseline, so the idea would be to repeat this in different clinical populations like spinal cord injury (SCI) , stroke, etc and compare the differences. Theoretically we could use this to even create a better way of measuring spinal cord function after SCI and come up with better ways to restore function or even create closed loop stimulation systems to help restore function. There’s a lot of different ways this technique could be used and establishing a baseline in a neurologically intact population is just the first step.
Okay, I said I would share the videos and I wanted to, but wordpress doesn’t allow it with my plan, so the workaround is a poorly compressed gif (for now anyway). The videos are going to be hosted with the journal as supplementary materials, but the paper is only “accepted” it hasn’t been through typesetting yet so the videos are not there yet, once the paper is typeset you can see the full size videos in all their brain-y glory.
There were 2 tasks we looked at (tonic contraction and rhythmic contraction) and 5 different EEG bands (delta, theta, alpha, beta, and gamma) so there are 10 total videos. At the bottom of each video is the force output, for the rhythmic contraction, this equates to ankle angle, for the tonic contraction, you can see the (small) changes in force over the time. The top left shows the time frame, we used a 2 second sliding window with a 1 second step size for gPDC, so we have a one second resolution roughly. Below is the difference between 30 Hz TSS and no stimulus rhythmic condition (RC) beta band.
Of course, none of this would be possible if it weren’t for the support of hospital-PI, school-PI and all the collaborators we worked with to make this happen. I also, as usual, want to say thanks to all of you for the support, the comments, the likes, the views, the emails, everything. It means the world to me and while I can’t say it keeps me sane, it keeps me on the funny side of insane and not the depressing side (mostly), so thank you. I’ve said thank you to everyone here so many times and words still fail me when it comes to describing the level of gratitude I have for all of you. This has been an amazing, albeit hard, journey.
Source:
Steele, Alexander G., et al. “Effects of transcutaneous spinal stimulation on spatiotemporal cortical activation patterns: A proof-of-concept EEG study.” Journal of Neural Engineering (2022).
aka “Last paper”


So if the TSS increases the functional connectivity between brain regions – that implies it’s getting them to sync up or exchange information in some way, right? And if it decreases it, it’s getting them to behave more uniquely or independently? Why do you think that’s happening? What does it mean?
Or is the “why” less important than the possibility of using this effect as a benchmark to measure how well the spinal cord is working?
LikeLiked by 1 person
June 25, 2022 at 7:45 pm
Hospital-PI would blow a blood vessel if he heard you talking about the why not mattering! The why matters for us a lot, but yes we were also establishing a baseline here.
So I guess I lost the “why” point in the length of the post. Yes, they are exchanging more information if the gPDC increases and less information if the gPDC decreases (so negative value in the decrease case).
We can only hypothesize at this point, but we had a sister study done using basically the same protocol but using fMRI: https://www.sciencedirect.com/science/article/pii/S2666956022000149?via%3Dihub
We concluded in both that TSS causes a shift to a more reflexive approach to mimicked standing and in our case mimicked walking. On average TSS reduced communication between motor areas and increased areas associated with reflexive behaviors, so that is our working hypothesis at the moment.
The findings actually support another paper I recently authored: https://www.mdpi.com/2077-0383/10/24/5958
We suggested in that the brain doesn’t exactly tell the spinal cord what to do, instead it removes certain limitations it places on the spinal cord and lets the spinal cord do its own thing, this reduces the need for the brain to intervene (meaning less brain power to walk/move/stand).
The major implication being that (1) if the spinal networks controlling walking/standing are still viable after SCI (meaning mid thoracic injury) and (2) we can figure out how the brain releases it’s control we could supplement the signal from the brain to the spinal cord and restore (some) volitional movement.
Oh, we also suggested that this method could be used to probe the viability of spinal circuits after SCI, which would basically create a continuous SCI scale to replace the ASIA scale. Which as you know is something I really want to create.
It’s all very exciting stuff, but I feel like we need to explain it better for the general public, which is why I like sharing here to try to clarify (since if you looked at the paper, almost 2 full pages are just math and deriving the equations we used, blah!)
LikeLiked by 1 person
June 26, 2022 at 12:16 pm
Congratulations! I am so proud of you. I feel like I am rooting for football, taking pride and enjoyment from your hard work. Our team won one!!!! Great job on the graphics! I am in full mothering mode because my son has COVID and woke me up to tell me he can’t sleep because his legs hurt…so I am going to take a second to remind you to make sure you get rest, eat proper food and are taking care of yourself.
LikeLiked by 1 person
June 26, 2022 at 3:14 am
Thank you! It was all thanks to support from people like yourself so you have plenty of reason to celebrate along side me!
I’m sorry to hear about your son. I hope he recovers quickly and without any long lasting effects.
Thank you, I’ll remember to take care of myself, same to you though! 🙂
LikeLike
June 26, 2022 at 12:02 pm