Day 13: Significance, Part 1

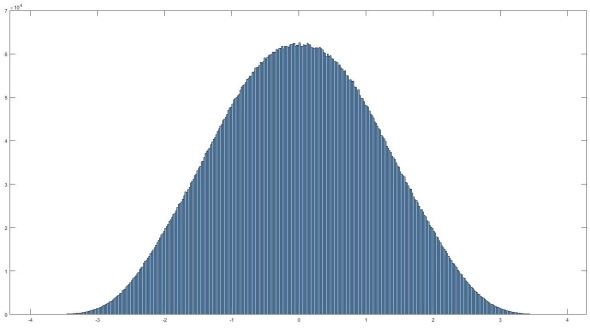
Histogram of normally distributed data. It looks very… nomal. No it really is normally distributed, read on to find out what that means and how we can use it.
If you’ve read my last post I hinted that today we would discuss filtering. Instead I think I want to take this a different direction. That isn’t to say we won’t go over filtering, we most definitely will. Today I want to cover something else though, significance. So you’ve recorded your signal, took an ensemble average, and now how do we tell if it actually means something, or if you are looking at an artificial or arbitrary separation in your data (IE two separate conditions lead to no difference in your data). Let’s look at significance.*


