Day 13: Significance, Part 1
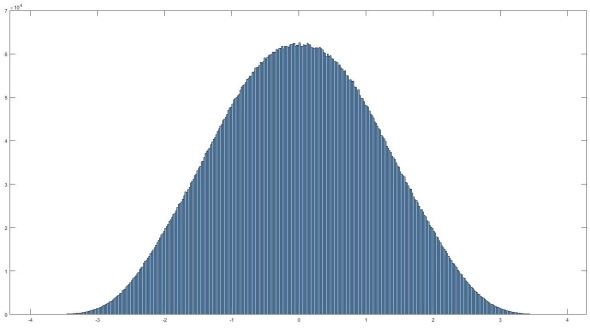
Histogram of normally distributed data. It looks very… nomal. No it really is normally distributed, read on to find out what that means and how we can use it.
If you’ve read my last post I hinted that today we would discuss filtering. Instead I think I want to take this a different direction. That isn’t to say we won’t go over filtering, we most definitely will. Today I want to cover something else though, significance. So you’ve recorded your signal, took an ensemble average, and now how do we tell if it actually means something, or if you are looking at an artificial or arbitrary separation in your data (IE two separate conditions lead to no difference in your data). Let’s look at significance.*
This topic could be weeks long, there is a lot of math and it can get very complex. We may even dig into it more later. If you’ve noticed though, I haven’t covered the math behind the topics we’ve covered. Don’t worry math nerds, I’m right there with you, we will dive into it later. Now though we are in the introduction phase of our 365DoA, so I want to get the broad strokes so you understand the topic before you try to understand how to use the tools in that topic.
First things first, a normal distribution (seen above) is the assumption of parametric statistics. There are three main assumptions to parametric statistics, on top of normal distribution, we also assume that the data collected is independent (meaning that one value has no relation to another value, ie if I flip a coin, I know that if the first result is a heads, it won’t impact the second flip). Lastly we assume the the variance of the data (how much it varies) is the same from different groups, also referred to being homogenous.
However, our data isn’t always going to be normally distributed. In fact, you can have multiple distribution types across your data depending on what you are interested in, for an example I’m currently working with some biological data and that normal distribution histogram is the output of the variance in my data at one frequency. Unfortunately I am analyzing a signal from 1 Hz all the way up to 100 Hz at 0.5 Hz increments and that means I have a lot of data (that plot is for one frequency “bin” and is 10 million different points, yeah… it’s a lot). So yes, this particular frequency is normally distributed, but what about other frequencies. As it turns out, just 5 Hz difference I see a distribution like below.
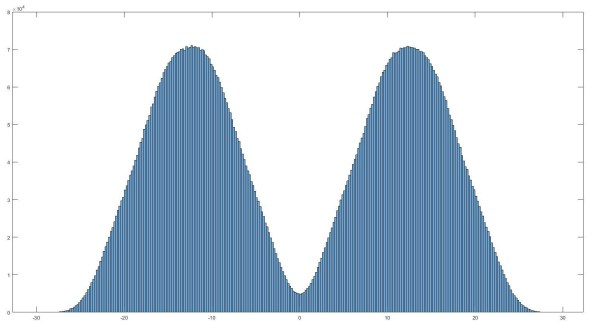
Histogram of the same data above, but at a different frequency
In this case we see what’s called a bimodal distribution of the my data. There are also some other types of distribution in my data and that means that the assumptions made using parametric statistical analysis are demonstrably false. So what do we do? Well there is another type of statistical analysis called non-parametric statistics (hey I didn’t name this stuff). Like parametric statistics we have some assumptions, but they are very broad, first we assume that a null hypothesis exists (IE it is possible to say that there is no difference between populations). This may seem silly, but we need to say it (and there are ramifications to this). Second, you have data that you can use to determine if you can reject the null hypothesis. This is a fancy way of saying that if my hypothesis is that a particular coin favors heads vs. tails and I use a different coin, I can’t say anything about my null hypothesis.
A null hypothesis is simply that there is no difference between conditions that is significant.
I guess we should define null hypothesis a little more explicitly. A null hypothesis is simply that there is no difference between conditions that is significant. Using the coin example I would say that after 100 flips I should see about 50 heads and 50 tails. This isn’t exact because of random effects (which we can call noise). So we say that our coin is bias (it favors heads or tails) if we record a number of flips that is either heads or tails that is suspiciously high. We will cover what that means next time, but for now I think we’ve introduced the very basics to the concept we want to talk about, what does it mean to have data that is significant. I know it’s probably not fun to have to wait another day to figure out where this is going, but trust me it will be worth it and I can dive into better detail when I split it up like this.
Until next time, don’t stop learning!
*Remember everyone, I make no claim to the accuracy of this information, some of it might be wrong. I’m learning, which is why I’m here writing all this. If you’re reading this then you are probably trying to learn too. If you see something that is not correct, or if you want to expand on something, please do it. Let’s learn together!!


But enough about us, what about you?