Day 22: Parametric vs. NonParametric Statistics

Technically we could call this parametric statistics part 2. However, since we are covering nonparametric statistics and more importantly the difference between parametric and nonparametric statistics, it would seem that this title makes more sense. As usual with a continuation, you probably want to start at the beginning where we define parametric statistics. Ready to get started?*
Last post we said that parametric statistical tests use the mean values of the data to determine if there is a difference between two (or more) data. We looked at something called a T-test a concept we will dive into in more detail in the future, but for now we said that a t-test compares two groups and is one of the tests we can use to figure out if we have statistically different datasets or if the separation is artificial (IE- a coin that we think is bias, but is actually not bias). We also introduced the idea of the mean without explicitly defining it and we should resolve that today. Today we are also going to introduce the concept of the median, which may be confusing if we don’t have a good definition for the either the mean or median. That said, let’s define both!
First let’s talk about the mean.
The mean value of a dataset is just the average of that dataset.
If our dataset looks like this a = [1, 39, 20, 6, 4, 210, 10, 20] then to find the mean we add all the values together like so (1+39+20+6+4+210+10+20) = 310. However, that gives us the total and not the mean, to find the mean we take our total and divide by the number of values we added in this case we have 8 different data points in our dataset, so we take 310 and divide by 8, in other words we have mean(a) = (1+39+20+6+4+210+10+20) /8 = 38.75. We can write the mean formula in a more general for like this:
mean(x) = sum of x/n
where:
x is our dataset
n is the number of data points
If we look closely at the data however, we see something interesting. The mean of all the numbers is higher than it would be if we eliminated the outlier of the group. Notice that all the numbers are under 40, with the exception of 210. In fact if we recalculate our mean without the 210 we find a totally different number. Where we call our modified data a-mod = [ 1, 39, 20, 6, 4, 10, 20] and mean(a-mod) = (1+39+20+6+4+10+20) /7 = 14.29. A rather large difference from mean(a) which we determined was 38.75, so what happened?
We had an outlier, this is why we have two different statistical approaches. Our data was most definitely not normally distributed (at least not with the number of data points we have). However, nonparametric statistics does not have this issue, for one thing, we can use the given dataset to determine the distribution prior to analysis, but more importantly nonparametric tests use the median of the data.
This may be more basic than you need, but just to be thorough let’s define the concept of the median. Afterwards, we can go into how that relates to nonparametric statistics.
The median value of a dataset is just the middle value of that dataset.
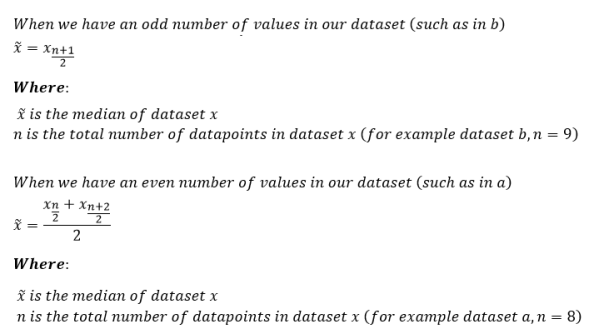
Say we have a second dataset b, where b = [ 1, 6, 4, 9, 5, 20, 526, 12, 60]. To find the median value of our data we would arrange the values from lowest to highest and select the middle value, our data ordered by size would look like this b = [1, 4, 5, 6, 9, 12, 20, 60, 529]. Notice this did nothing to the dataset itself; we made no changes to the values, we just ordered it. Next we find the middle value, in this case we have 9 data points so our middle data point would be four data points from the left side of the data and four from the right. This gives us a median(b) = 9. The mean of the same dataset on the other hand is a much, much larger at 71.44 (you can check this yourself if you want. Again, the outlier pulls the mean of the data away from the mean of the dataset without the value.
So far so good, but what happens when we have a dataset with an even number of values? To use our previous example, we can take the median of a, which we find by finding the middle values of the data. Let’s look at how we do that. First we do what we did before, sort the data by size so we now have a = [1, 4, 6, 10, 20, 20, 39, 210]. If we notice there are two middle values, if we count three values from the left like we did in our previous example, we end at 10. However, if we go three numbers over starting at the right we end at 20. The solution is to use both numbers. In this case the median value is just median(a) = (10+20)/10 = 15. We can write this formula in a more mathematical way by saying that:
Now we’ve seen that our mean and median are definitely not the same things. We’ve also shown that our mean can be heavily influenced by outliers that are much larger than the average of the rest of the numbers in our dataset.
This brings us back to parametric vs. nonparametric testing. When we use nonparametric testing we are testing the medians of the data, not the means. This works well when our data is not normally distributed (as we saw with our example datasets a and b). Unlike parametric tests nonparametric testing doesn’t need you to assume that your data is normally distributed, but more importantly, nonparametric testing doesn’t require you to assume that your data are independent.
Now we need to tackle the main question. When do we use parametric testing and when do we use nonparametric testing? That isn’t an easy question to answer. For one thing, for any dataset that satisfies the requirements set by parametric testing, nonparametric testing can still be used. However, since your here you probably want a better answer than that, so let’s formalize it a little better.
Why use parametric tests?
First, if we are going to use parametric tests, you need to make sure you satisfy the requirements, namely:
- Our data are normally distributed
- Our data points are independent of each other
- Data from multiple groups have the same variance
- Your dataset has a linear relationship
We will go over points 3 and 4 in more detail in other posts.
Okay, so you satisfy the requirements, why use parametric tests over nonparametric ones? First, parametric tests have more statistical power than nonparametric tests. That is just a fancy way of saying that you are more likely to find significance in your dataset if it actually exists (IE less of a chance of running into a type 2 error).
Parametric tests work well with continuous type data (which we can define later), that are non-normal if you have a large enough sample size (typically for a 1-way T-test you want a sample size n>20, for a 2-way t-test you want a sample size for each group larger than 15). We will dive more into what tests are which at another time, but for now just know that sometimes there are exceptions to rules, this is one of them.
Why use nonparametric tests?
This should be fairly straight forward. Nonparametric tests should definitely be used when you don’t meet the assumptions needed to use parametric testing. Another good reason is that your data is better represented by the median. Their is a reason we covered mean and median today, sometimes the mean just won’t work when you are analyzing your data and you’ll run the risk of making a type 1 error.
A good example of a real dataset that would be better represented by the median over the mean is income. Think about it, you have people like Jeff Bezos with a net worth of something like 114 billion (with a b, which 1 billion is equal to 1,000 million). This will heavily skew your data and if you try to draw conclusions using the mean instead of median, you may wrongly conclude that American’s are millionaires, which (checks bank account)yeah, still not the case.
At the end of the day, when we are talking statistics we need to look at how our data are best represented. Would it make more sense to talk about the mean of our data or the median of our data? Answering this question will be the most helpful in determining which type of statistical analysis should be used for your data.
Well, this ended up being a bit longer than I thought. Next up I think we will talk about different types of tests. Or maybe we can talk about different types of probability curves. There is just so much we can talk about and it’s all related somehow so it’s tough to decide which topic is best to cover. In any case, today we’ve talked parametric statistical tests and nonparametric statistical tests, so hopefully we’ve cleared up the difference!
This post marks 1000 posts across lab topics. Look at us go!
Until next time, don’t stop learning!
*As usual, I make no claim to the accuracy of this information, some of it might be wrong. I’m learning, which is why I’m writing these posts and if you’re reading this then I am assuming you are trying to learn too. My plea to you is this, if you see something that is not correct, or if you want to expand on something, do it. Let’s learn together!!


But enough about us, what about you?