Data visualization dilemma


Data visualization is an important topic to think about. How do you best convey what the data are telling you? It’s something I struggle with because I take it so seriously. Most things can be done simply, the old standby the line graph, box plot, or even scatter plot all work well enough, but more often than not, you want to tell a story and sometimes the obvious plot isn’t the best choice.
(more…)On randomness

Pick a number between one and ten. You picked the number seven. Was I right? Doesn’t matter, the point is there’s a slim chance you picked one or ten. The reason is simply because humans are bad at random number generating. Fear not! Computers are bad at it too, but that’s a problem for a world that revolves around cyber security. Randomness is so important to our daily lives, that we don’t even notice it… mostly.
(more…)Analysis fails


I’m an idiot. So for the past few weeks I’ve been working with our super fun new dataset! Like a big kid, I did the statistics, made the checks to ensure that the assumptions held, then got my result. Everything was going well until I realized there was a typo (here) in my code. Well it turns out that wasn’t my only problem, but everything should be fixed now… should.
(more…)The homework rush


Not the most exciting of topics, especially after yesterdays news that I’m giving a presentation at the BRAIN conference, but my homework is due tomorrow. This will be the first time this term that I haven’t finished it early. Normally I will have turned it in days in advance to get it off my plate, but there’s so much going on that I’m not even certain that I will have the chance to finish it. What do I do in that situation? Well keep calm and carry on… I’m not British, but I think that’s how the phrase goes.
(more…)Defining parametric tests in statistics


We’ve been throwing around the term a lot in this series. I’ve been saying in parametric statistics this, in parametric statistics that, but I kept putting off giving a definition. It’s not because it’s hard to understand, it’s just that typically when you’re doing statistics you already know if you’re using a parametric test, but because we try to make no assumptions in this series, we’re going to put this to bed once and for all. Today we’re talking about parametric statistics!
(more…)Independence in statistics


A while back we introduced the central limit theorem, it was a way to take data and make it normal (gaussian) as if by magic, which is one of the assumptions needed for parametric statistics (the most commonly used kind). Today we’re introducing another assumption, that the data are independent. The idea of independent events is probably straightforward, but it’s yet another bedrock of statistics that we should talk about in depth to help us understand why things are the way they are.
(more…)Variance in statistics


Variance, it’s one of those concepts that get’s explained briefly then you find yourself using it over and over. Now that I have a free moment, I figure it’s about time to revisit the “simple” concept and just take a minute to apricate why we have to deal with variance so often and why we try so hard to minimize it when we’re doing experiments. Just like the discussion about the mean, there’s some subtilty that goes into the idea of variance and it’s square root cousin standard deviation and we skip over it in favor of getting into more complex topics.
(more…)Fun with Rstudio


Okay, not really. Having to use R is a pain. I’m not a fan and the structure they use is very confusing to me as someone who uses MATLAB on a regular basis. I understand matrices, I regularly make and successfully work with higher dimensional matrices ( > 3, which hurts your brain to think about a 20+ dimensional matrix, but hey whatever gets the job done). R on the other hand feels foreign and the commands feel clunky.
(more…)The Bonferroni correction in statistics


Well we’re doing it, today we’re talking about the Bonferroni correction, which is just one of many different ways to correct your analysis when you’re doing multiple comparisons. There are a lot of reasons you may want to do multiple comparisons and your privacy is our main concern so we won’t ask why. Instead we’re going to talk about how to adjust your alpha (chances of making a type 1 error) so you don’t end up making a mistake.
(more…)One-tailed vs. two-tailed tests in statistics

Sit right back because we’re telling a troubling tale of tails full of trials, twists, and turns. The real question is, will we run out of words that start with t during this post? It will be tricky, but only time will tell. When do we use a two-tailed test vs. a one-tailed test and what do tails have to do with tests anyway? With a little thought, I think we can tackle the thorny topic. In short, let’s talk tails!
(more…)The p-value in statistics


We’ve been dancing around the p-value for some time and gave it a good definition early on. The p-value is simply the probability that you’ve made a type one error, the lower the p-value the less chance you have of making a type one error, but you increase your probability that you’ll make a type two error (errors in statistics for more). However, just like with the mean, there’s more than meets the eye when it comes to the p-value so let’s go!
(more…)The z-score in statistics

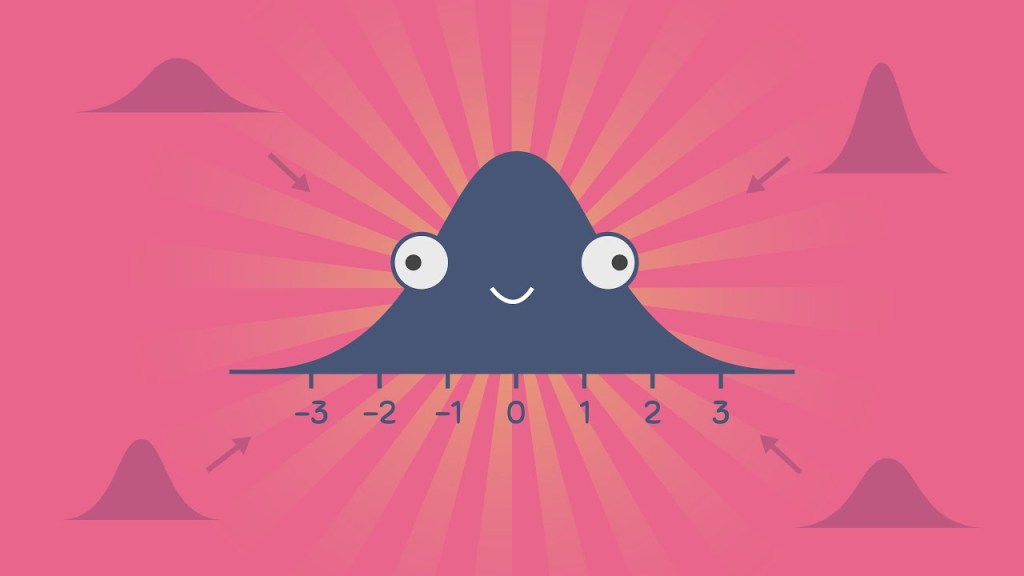
Okay, time to get back to statistics, if only for today! P-value, z-score, f-statistic, there are a lot of ways to get information about the sample of data you have. Of course, they all tell you something slightly different about the data and that information is useful when you know what the heck it is even trying to tell you. For that reason we’re diving into the z-score, it’s actually one of the more intuitive (to me anyway) measurements so let’s talk about it!
(more…)The mean in statistics


Yeah it seems simple, I mean (no pun intended) the mean is just the average! Yet as with so many different things in statistics there’s more to the mean than meets the eye! We’re going to go into why the mean is important, why it’s our best guess, why it may not always be your best option, and why we work so hard to find the mean sometimes! It seems simple, but I promise today we’re answering a lot of the big “why’s” in statistics, so let’s go!
(more…)The Tukey test in statistics


No, not turkey, Tukey, although they are pronounced very similar (depending on who you ask I guess? I’ve seen people pronounce it “two-key”). Any way, today we’re saving our job and the wrath that comes with failure. The mad scientist boss of ours tasked us with testing mind control devices and determining statistically which one (if any) worked. After the last failure, we now had four new devices to test, so we couldn’t use the same method as before. However, an assistant’s work is never done, we didn’t finish the job! That’s what we’re going to do today.
(more…)The ANOVA in statistics


Our mad scientist is back and this time they are not taking any chances! After statistical failure in the last example, they created not just one, but four mind control prototypes! We’ve been tasked with determining if they are working or face certain DOOOOOOOM! Sure, working for a mad scientist can be stressful, but we can do this… right? I’ve been dreading this post and you’ll see why, there’s a lot to cover before we solve the mystery, so let’s dive into it!
(more…)Significance in statistics


That feeling when your p-value is lower than your alpha, aww yeah! But what does it really mean? It’s one thing to say there is significance and on the surface it means the two things are different “enough” to be considered two things, but I think there’s a simpler way to explain it. So today we’re going to talk about what significance actually means in the practical sense. Maybe it’s super obvious, but it never hurts to state it anyway.
(more…)The f-test in statistics

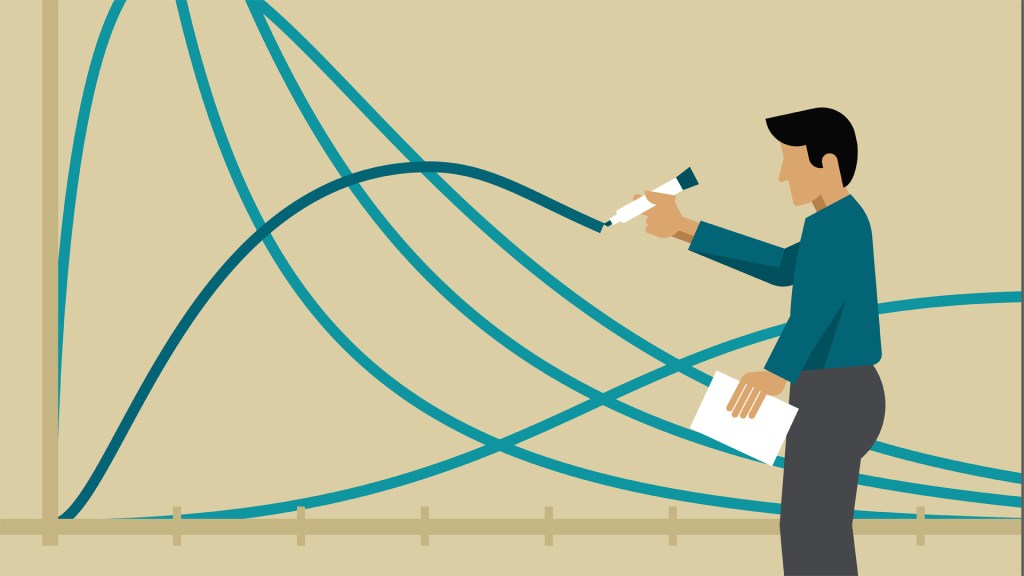
Yep, we’re getting right back into it. I’m still working out things from yesterday, so we can just talk more statistics. This will be an interesting one and hopefully it will be pretty straightforward. The f-test, which in this case is really the f-test to compare two variances. You may have guessed, but the t-test uses the t-distribution (sort of like the normal), well the f-test uses the f-distribution, which is nothing like the normal! Let’s dive in, shall we?
(more…)First project deadline!


I didn’t have anything particularly lined up for today to add to the “in statistics” posts I’ve been doing, so today I thought it may be better to outline what I’m doing in the statistics course I’m taking. At the very least it may help me get it done, because as usual around here, the project is due… today. Yep, it’s yet another mad dash to the finish. Will I make it? Will I ever figure out what statistics is? Will I learn to stop asking questions in this format? Find out all this and more!
(more…)Confidence intervals in statistics


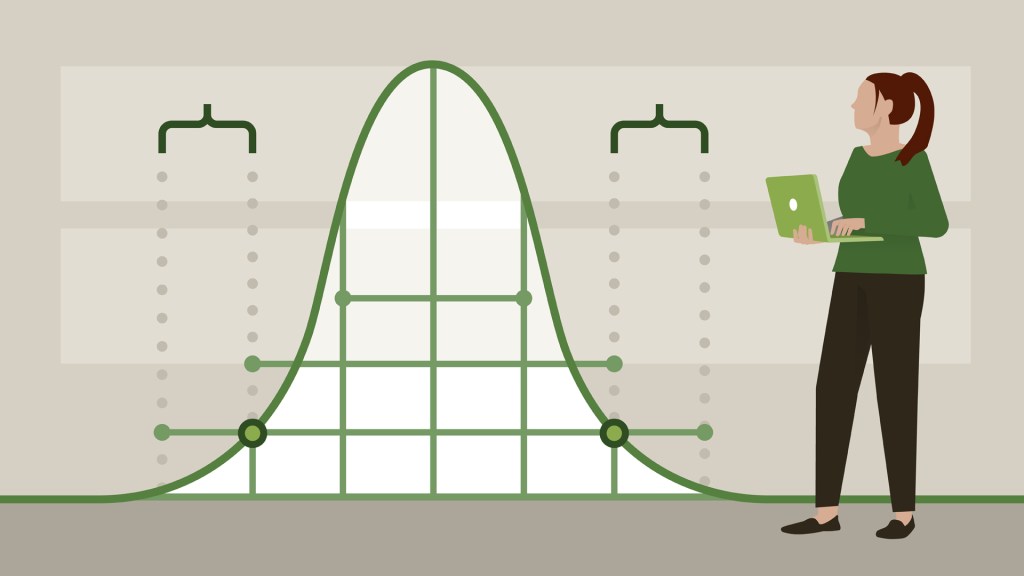
Well since our mad scientist from yesterday’s post is on a short break, today we’re going to fill in some of the gaps that post brought into view. First up is the confidence interval. There are some subtle points here, so this should help clarify a few things that may not have been clear yesterday. We’re going to do a somewhat deep dive into what the heck we’re doing when we talk confidence interval and why the standard deviation of our data is important in determining the values.
(more…)The t-test in statistics


Welcome fellow mad scientist enthusiasts, the last time we talked statistics, we found ourselves in an interesting situation and we need to figure out if the mind control device that was developed is actually working. We introduced the idea of a two population problem and today we’re going to use something called a t-test to determine if our mad scientist succeeded.
(more…)Two populations in statistics


As a mad scientist, or maybe just a grumpy scientist, you want to test a new mind control technique! To do this you decide that you want to test this works by having people select one of two objects set in front of them. *Insert evil laugh* Using your mind control technique you want your unwitting participants pick the object on the left. You don’t get 100% success, but suspect it’s working, how do we know for sure?
(more…)A fair coin in statistics


It has been a busy day, but the show must go on so to speak and I’m here today to tell you I have a nice shiny new coin for us to flip! The catch you may ask? Well it could be a fair coin or I may have just swapped it out for a coin that was not fair! Our goal is to see if I’m being sneaky and to do that we’re going to need some statistics!
(more…)The central limit theorem in statistics


Today we’re gonna push it to the limit! The central limit theorem that is. It’s a cornerstone in statistics and the short and dry version is that it lets us turn any distribution we have into a normal distribution. If it wasn’t for the central limit theorem statistics would hurt far worse than it does now (speaking as someone taking a stats class now). For the longer version we need to discuss why a normal distribution is needed, why we prefer to work with them!
(more…)Effect size in statistics


We’ve been talking statistics for the past few days and today we’re talking effect size. The short explanation is effect size is the difference between two conditions! The bigger the effect size, the easier it is to tell the two conditions apart, easy… right? There’s a lot that goes into determining effect size, after all it’s hard to know what your effect size is without having some prior knowledge about what you’re groups look like, so let’s go into some detail.
(more…)Errors in statistics

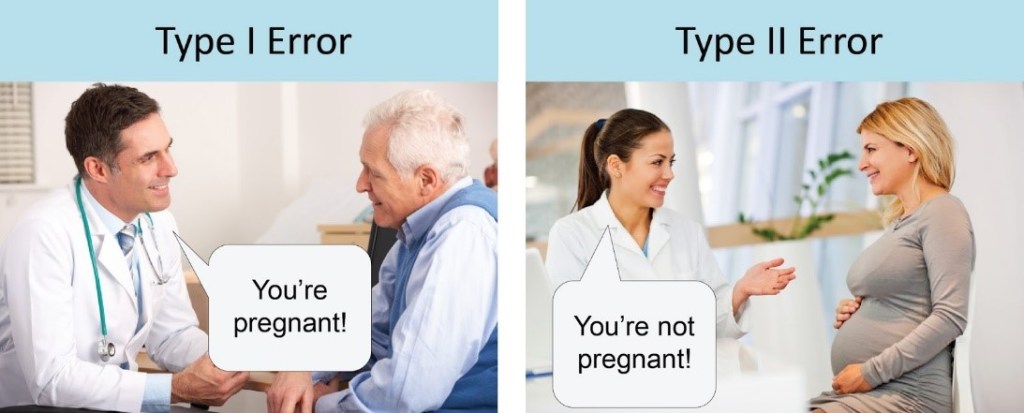
Everyone makes mistakes, that’s okay! In day to day life there are a lot of different ways you and I could make mistakes. In statistics however, there are just two ways for you to make a mistake. That may sound like a good deal, but trust me when I say two ways to make a mistake is two too many. To think, you spent all that time picking the right statistical test, did the experiment, analyzed the data, just to make an error in the end. Don’t worry, it happens to the best of us, but knowing what they are will help you prevent them!
(more…)The hypothesis in statistics


As promised today we’re talking statistics for experiments! It’s more interesting than it sounds… okay it’s exactly as exciting as it sounds. Depending on who you are that’s a lot or not at all. No matter where on the spectrum you fall, knowing how it works is useful. So we’re starting at the beginning and discussing what a hypothesis is and how we test it.
(more…)The last PhD requirement


We’re already at the end of the month, how the hell did that happen? It’s been close to a month and a half since the term started and it feels like it’s flying by. I realized that when I first started this project I covered a lot of the stuff I was learning at the time. In fact one of my previous class notes posts was in my top 10 highest viewed blog posts for 2020. Somewhere along the line I stopped doing that, so today we’re going to talk about what I’m taking this term, why I’m taking it, and why I’ll probably be adding a few step by step instructions for how you can do what I’m learning too in some of my upcoming posts.
(more…)Day 62: Two Random Variables A2

Like we did with question 1, this will be the solution to the question we posed in the last post, if you haven’t tried to solve it yet, go give it a shot. If you have and are dying to check your answer, then let’s look at the solution.*
Day 61: Two Random Variables Q2
For those of you who have been following along, today we are going to post another question and in the next post we will give the solution. This will be another two random variable question and we’ve covered everything you need to solve it in our previous posts. So with that, let’s get to today’s question.*
Day 60: Two Random Variables A1
Hopefully if you’re reading this you saw our last post, where we gave the question we will solve today. If you haven’t had a chance to try and solve it, please feel free to stop and give it a shot. If you’re ready to see how we solve it, then let’s get started.*
Day 59: Two Random Variables Q1
Well now that we’ve had a minute to take a breath, let’s try out something new. In this post I will give the question and in the next post we can work out the answer. For those of you playing at home, this will be a good way to check your knowledge and for me, it will give the the chance to do the same.*
Day 56: One Function of Two Random Variables Example 3
Today we are solving this guy!
Okay quick example, still not super difficult, but one we can work out to a complete solution. We’ve gone over a few examples now, but we’re going to go over a few more for both my benefit and yours. So let’s dive in.*
Day 55: One Function of Two Random Variables Example 2


Don’t worry, the image ties into what we are doing today, I promise!
Well our last post we took a break and talked zombies! While I would love to do a whole month of halloween topics, this year is not the time, maybe next year. In any case today we are going to go over another example of a single function of two random variables. This is going to be slightly more complex than our first example, however it won’t be extremely complex (we’re working towards it). So let’s take a look shall we?*
Day 53: One Function of Two Random Variables Example 1


Hopefully at this point we’ve demystified more than just a few concepts at this point. Today we are going to look at one function of two random variables. Originally I was going to break into a joint CDF example that involved dependent variables, but it turns out my book doesn’t cover that! Oops, guess I should’ve read ahead. In any case let’s talk functions!*
Day 52: Joint Cumulative Distribution Function Example 1

We’re getting into some interesting things today!
Well here we are again, today we are talking functions of two random variables. If you’re looking for the beginning, this isn’t it, but you can read the introduction here. If you’ve kept up, then you’re ready to go over the example we have today, so let’s get started.*
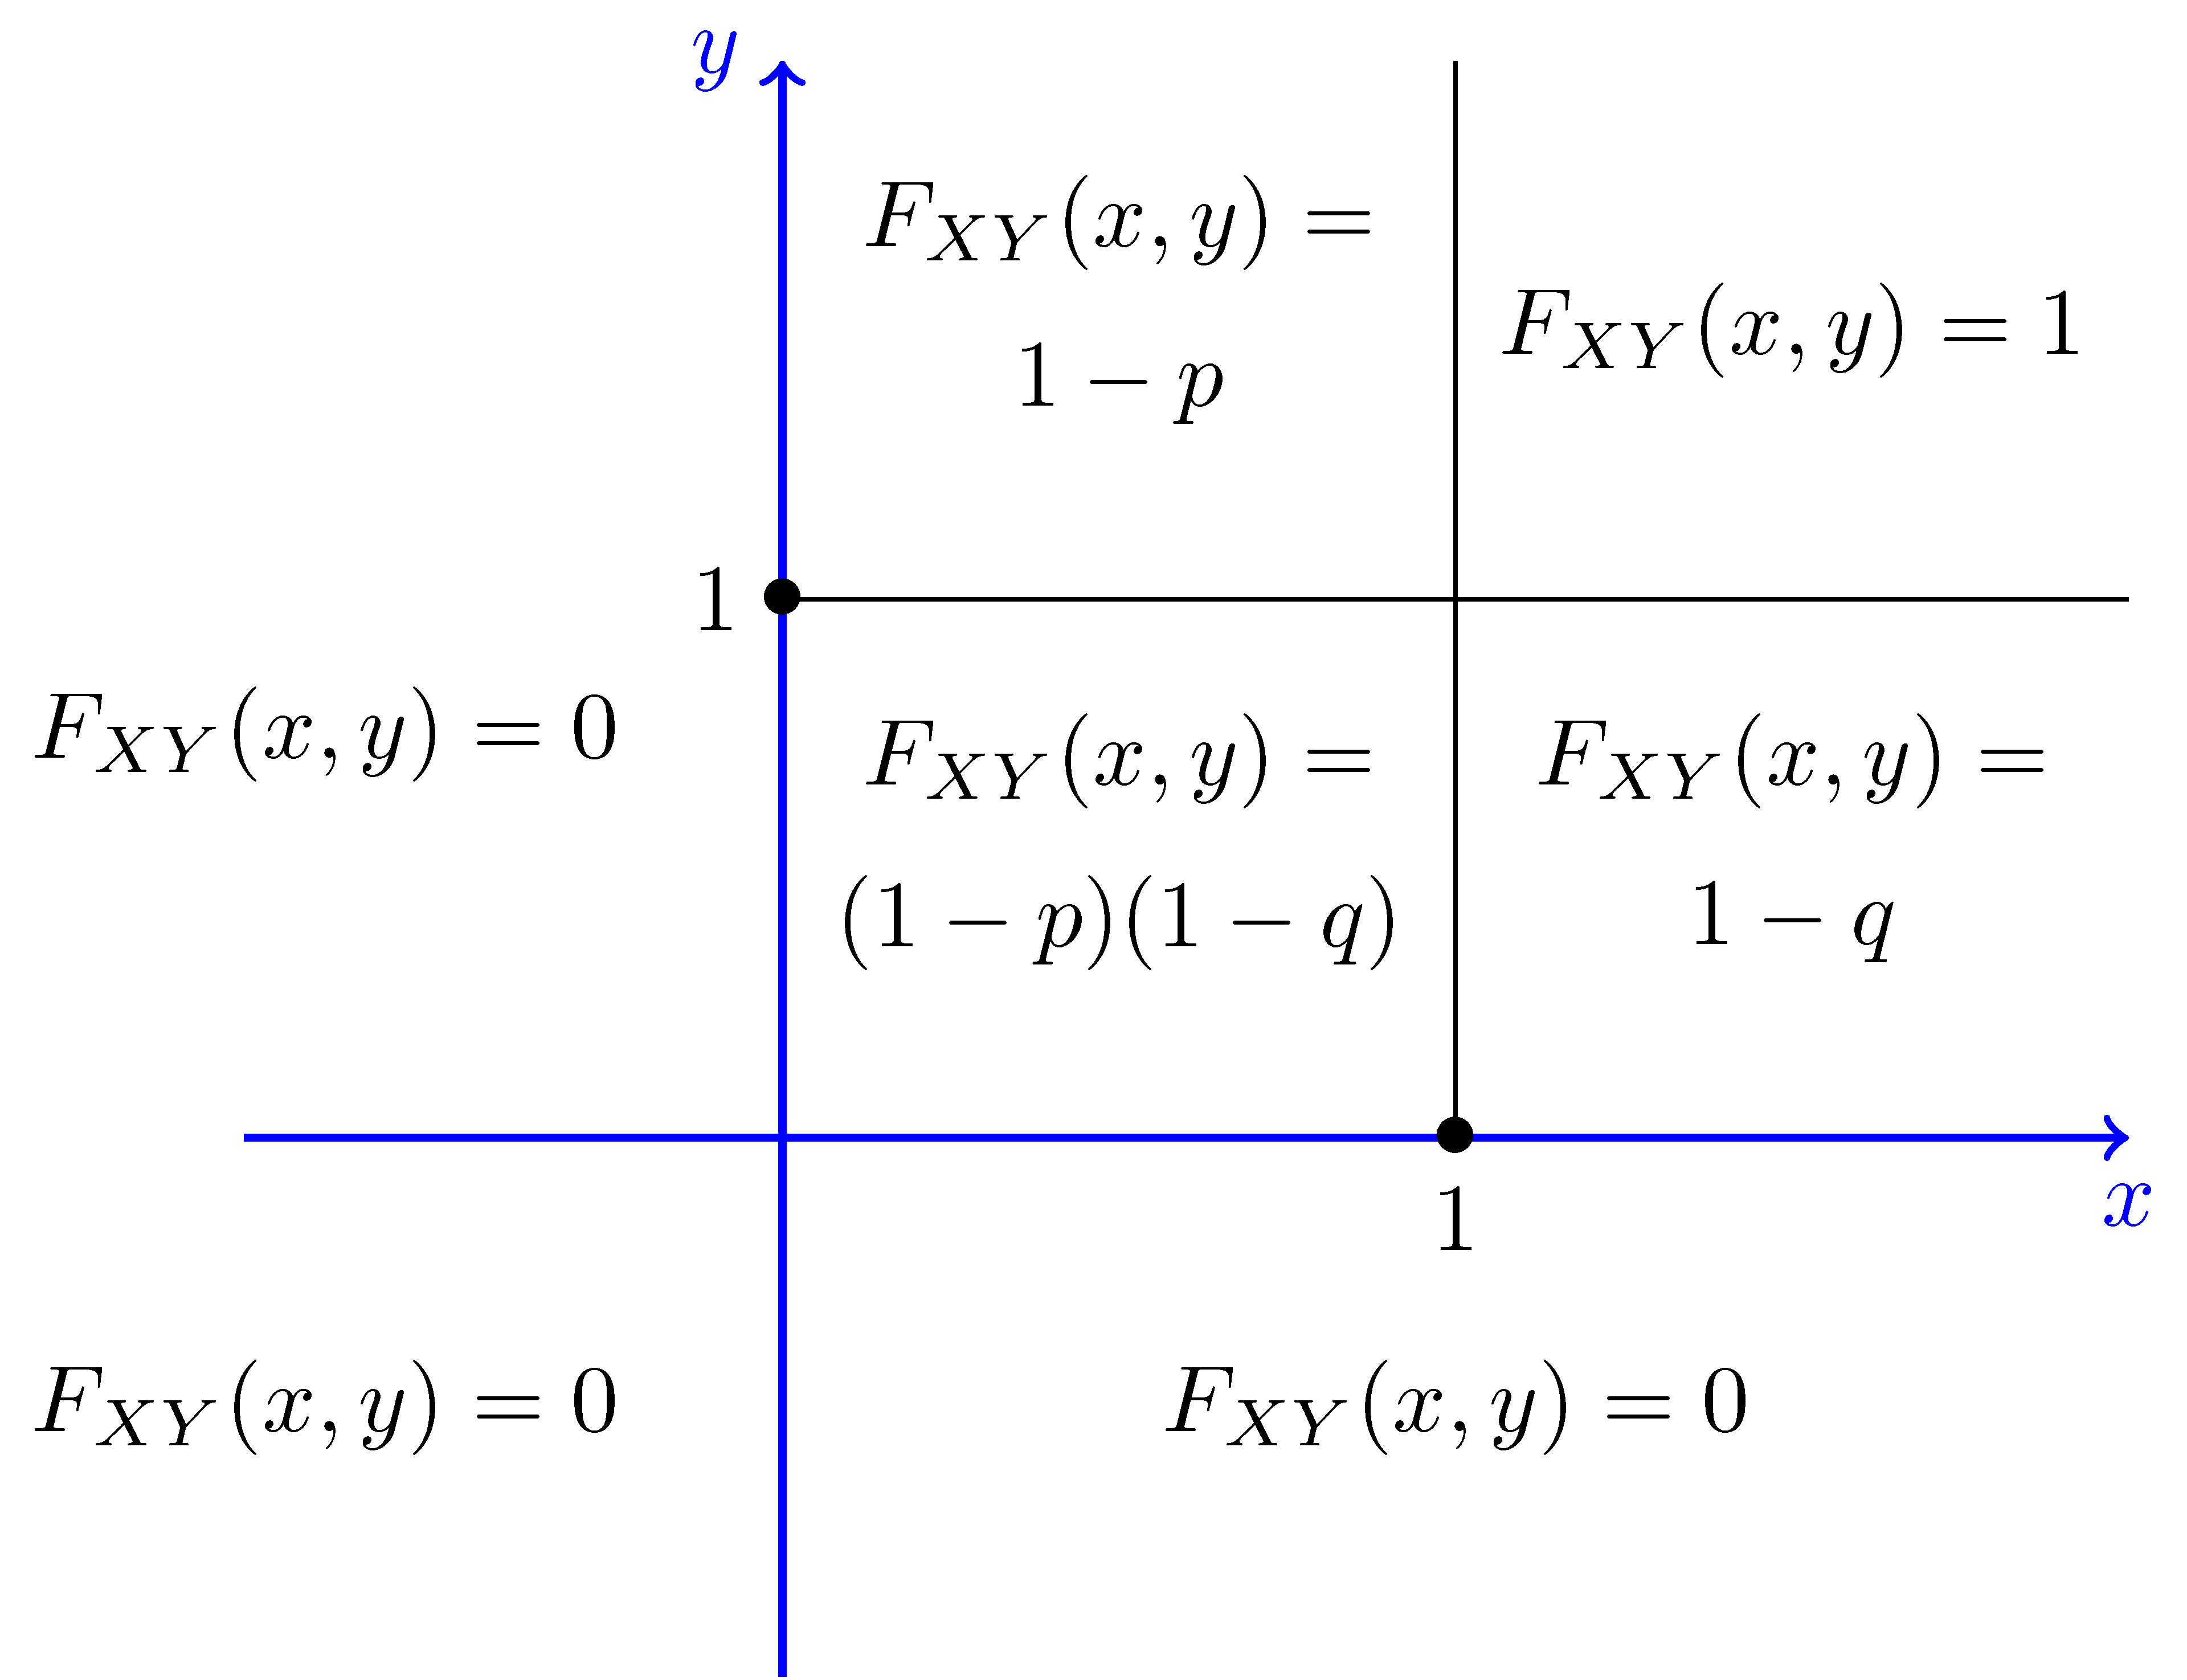
Day 51: Joint Cumulative Distribution Function

As promised, today we are going to talk about two random variables that are not independent. This means that the individual probabilities don’t sum to be equal to the joint probability (like they did yesterday). Like our normal CDF, we can find a CDF for two random variables, but let’s take a look at how this works.*
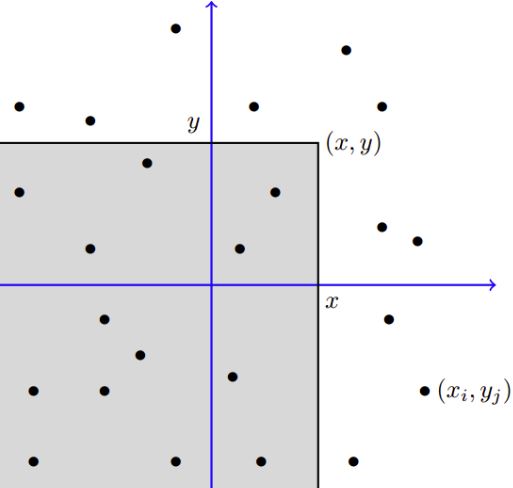
Day 50: Intro to Two Random Variables


I was debating about not posting anything today. It’s been a bit rough for me these past few days. However, I’m going to write a little something today and tomorrow to introduce two random variables (so we don’t skip a day). This is going to be a lot like our single random variable examples, but (of course) more complex, let’s take a look at what I mean.*
Day 49: Functions of One Random Variable Example Part 5
Let’s look at something a bit different today!
If you’ve been following along, we’ve been taking it easy the past few days. I’ve also been going over (relatively) simple examples, so today we’re going to take a more complicated example and work through solving it. I may go over a few more examples to be honest, only because this is important to what comes next, after we nail this down, we’re going to get into functions of two random variables and as you can imagine that’s a little more complicated (a lot more).*
Day 48: Functions of One Random Variable Example Part 4

A simpler example than yesterday.
Still feeling under the weather, but the show must go on as they say. So today let’s look at another example of how to solve functions of one random variable. Today will be another shorter post, but as usual I’ll try to explain everything step by step and hopefully you’ll see the methodology behind solving these types of problems.*
Day 47: Functions of One Random Variable Example Part 3

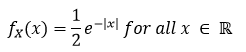
Let’s solve this guy.
Bad news readers, I’m feeling a bit under the weather. Today we’re going to go over a quick example. It’s not the one I had in mind, but it’s fairly straightforward and should help make some more sense of everything we are covering. When I start feeling better we can get into some of the newer concepts.*
Day 46: Functions of One Random Variable Example Part 2

Another Joke by xkcd
As promised today we are going to look at another example of how to solve functions with one random variable. If you haven’t you may want to start with our first post on the subject here. For those of you who are caught up, let’s get started.*
Day 45: Moment Generating Functions

There wasn’t a good visual for what we are talking about today, so how about a joke instead?
Well from the views it looks like my function of a random variable example was a big hit. Hopefully we’re clearing a lot of the confusion up now that we are looking at some examples of how to solve these and we can get a better grasp of how this works. Today we’re going to introduce a new concept, this one is going to be a bit more complex than our last, so you may want to review our last post before we start.*
Day 44: Functions of One Random Variable Example Part 1

Really, this is all we are doing, but let’s make some sense of it.
Well maybe yesterday was confusing, maybe it wasn’t. In any case, today should clarify some things for you if you are confused and should make things more clear if you are not. Today we are going to go over a quick example of what a function involving one random variable looks like. Now you may notice I keep saying one, that’s because you can technically have as many variables as you want, but since this is fairy complex stuff, let’s just stick with the one for now.*
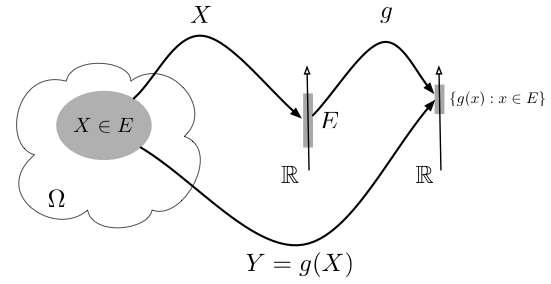
Day 43: Introduction to Functions of One Random Variable

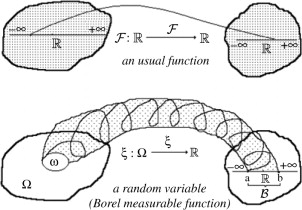
Yep we’re getting a little complicated, but let’s see if we can make sense of this.
Now that we’ve looked at conditional probabilities we can talk about other things we can do with random variables. If you’ve been keeping up with us so far, then this shouldn’t be too crazy of an idea, really all we are going to do today is take a random variable and transform it somehow. Interested? Let’s go!*
Day 42: Conditional Probability

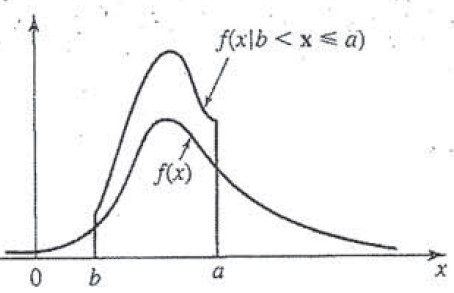
How does this not exist on the internet?! This is directly from my book, so it looks a little… well loved.
Up to now we’ve been dealing with single variable pdf and the corresponding CDF. We said that these probabilities relied on the fact that our variable of interest was independent. However, what if we knew some property that impacted our probability? Today we are talking conditional probability and that is the question we will be answering. It’s going to be a long, long post so plan accordingly.*
Day 41: Connecting the Concepts

Maybe we shouldn’t phrase it this way, since there is still quite a few days left of 365DoA, but you made it to the end! No, not THE end, but if you’ve been following along the past few posts we’ve introduced several seemingly disparate concepts and said, “don’t worry they are related,” without telling you how. Well today, like a magician showing you how to pull a rabbit from a hat, let’s connect the dots and explain why we introduced all those concepts!*
Day 40: The Normal Approximation (Poisson)


Poisson’s return!
Day 39: The Normal Approximation (De Moivre-Laplace)

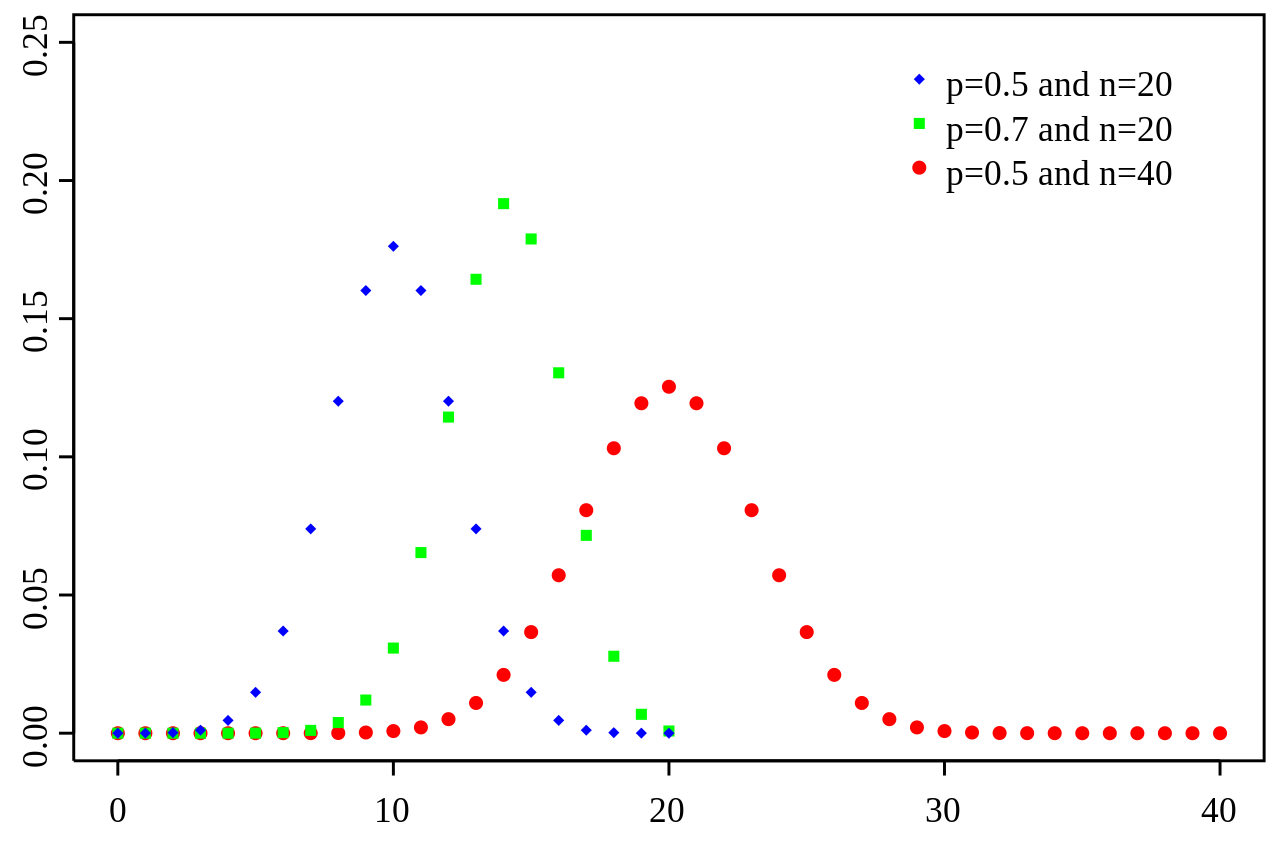
The binomial distribution, don’t worry we’ll get into it.
Day 38: The Poisson Distribution

The Poisson distribution changes shape as λ changes
Day 37: Bayes’ Theorem

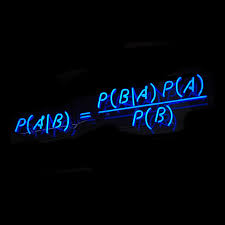
We’re talking Bayes for days.


