The ANOVA in statistics

Our mad scientist is back and this time they are not taking any chances! After statistical failure in the last example, they created not just one, but four mind control prototypes! We’ve been tasked with determining if they are working or face certain DOOOOOOOM! Sure, working for a mad scientist can be stressful, but we can do this… right? I’ve been dreading this post and you’ll see why, there’s a lot to cover before we solve the mystery, so let’s dive into it!
As usual I’m taking a crack at explaining the why in statistics, with my “in statistics” series (check the math category for all of those posts!). We’ve slowly been building up our foundation so we can confidently conquer some of the tougher concepts in stats. Today we’re diving into the ANOVA, which there are two types, a one-way ANOVA and a two-way ANOVA. We’re going to talk about the one-way ANOVA for now and later maybe we can dive into a two-way ANOVA. I’ll define the difference here in just a minute. So now that we know which ANOVA we are using, let’s start talking about it.
If you’ve been following along a t-test let’s us test the difference of the means between two samples. There are two types of t-test (okay, technically three, but we’re going to only really cover two) and the one we used last time is a paired t-test, the other type of test is an independent t-test and is used when we have reasons to believe there is a difference in the two samples to start. Say for example we want to compare improvement in test scores from two schools using a new method. One school could have significantly higher average test scores to start, which makes the comparison not fair. In those cases we use the independent t-test and really the difference between the paired and independent tests is how we treat the mean and variance, in a paired t-test we “pool” them in an independent test, we keep them seperate. Again we’ll get into the details some other day.
Why are we talking t-tests? Well we COULD theoretically use a t-test to see if our mad scientist succeeded! To do that we would have to compare every pair of devices we could make, so if we had devices 1 through 4, we would have to test 1 vs 2, 1 vs 3, 1 vs 4, 2 vs 3, 2 vs 4, 3 vs 4. This doesn’t even include our control group! We DO NOT do this thankfully. I mean that’s 6 tests just for this example, imagine how complicated it would be to compare 10 different things,that would be 45 tests! The other issue is the confidence decreases everytime we do this. The first test gives us an error of 0.05 or 5% chance of making a type 2 error, but it’s multiplicative, so we have a 5% chance for the first and another 5% chance for the second, etc. in the end even just doing 6 tests we go from a 95% confidence to a ~73.5% confidence (0.95^6), or a ~26.4% of making a type 2 error! Again that’s just 4 different things we’re comparing, but if we did 10, we would have a ~40% chance of making a type 2 error.
Basically the alpha (our chance of making a type 2 error) gets outrageously high the more comparisons we do. This is where the ANOVA comes in. The ANOVA is a single test for all our samples so we don’t have the increasing alpha issue. It works by comparing the variance between the sample means to the variance among the observations within the samples. Put another way, it compares the means between the samples and determines whether any of those means are statistically significantly different from each other (by using the variance, since that is how we determine how “separate” our samples are from one another).
A one-way ANOVA is used when we have one independent variable. That isn’t to be confused with a single variable, an independent variable is just something that cannot be changed, like brand of car (from yesterday’s example), or mind control device (for today’s example). If I were comparing two independent variables like brand of car and weight, I would use a two-way ANOVA (weight and brand are independent variables because I cannot affect the weight or brand of the car!). In our case, the independent variable is our mind control device, we have 4 devices, but they are all mind control devices. Our DEPENDENT variable is the thing we’re trying to effect, so if I had a medication that reduced blood sugar in diabetics, the independent variable would be the medicine and the dependent variable would be blood sugar.
Now that we know what it does and why we use it, let’s apply it to our task at hand! Our mad scientist after reviewing the previous experiment decided that we were going to eliminate the possibility of one hand being favored so no more selecting an object for us! Instead our “willing” participants were told to pick a number between 0 and 50. Secretly our device will attempt to force them to select 50. After testing our groups (we have 5, since there are 4 mind control devices and a control group), we can plot the data to see what everyone selected.
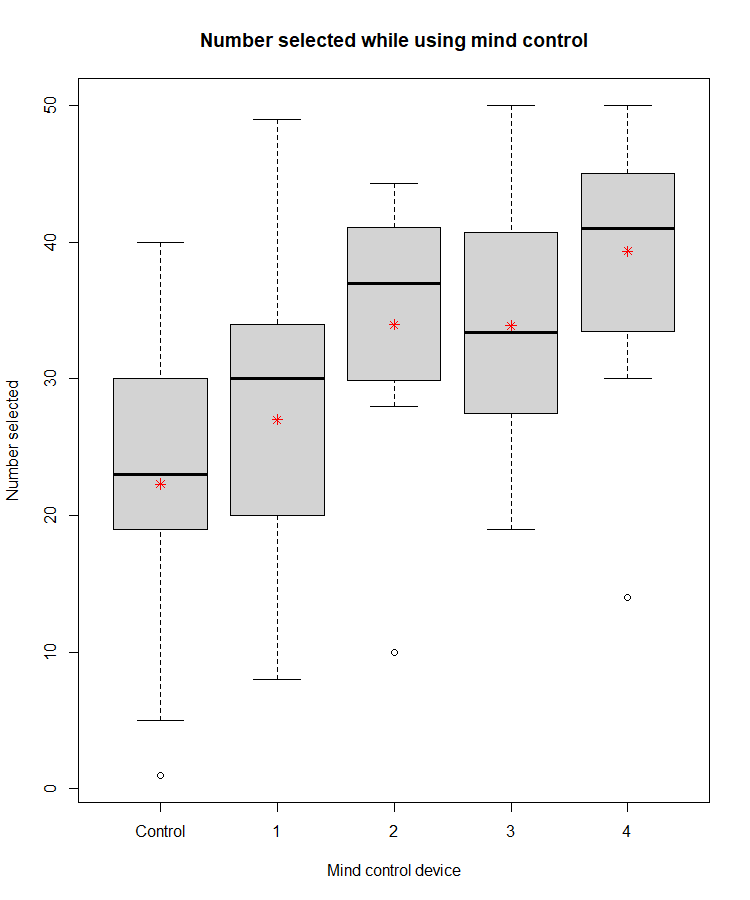
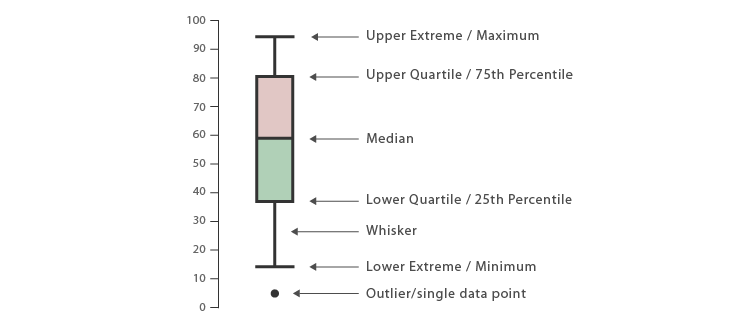
The above is a boxplot showing our data. If you’re not familiar with a box plot, the box itself is the first and third quartiles, the whiskers (the dotted lines) represent the maximums in our data. The dots, those are outliers or data that fall outside of 2 standard deviations from the mean (calculated from the dataset for that group, control, 1, 2, etc). A quartile is just a quarter of the data, so nothing crazy going on there. The line is the median value or the middle value, the red asterisk (*) is our mean or the average value. If you prefer a figure to help you understand, the figure below has all the anatomy of a box plot labeled (note: I added in the mean manually, that’s not normally shown on the boxplot). Already it LOOKS like something may be working with the 2nd and 4th mind control device, but is it significant?
To check this we can run the ANOVA! Now I’m going to use software for this (Rstudio, since it’s what I’m using in the course I’m taking and even though I hate it). Chances are, you will NEVER do this by hand, but it’s good to know what’s going on behind the scenes and we can’t explain the why without explaining the how, so this is how we calculate the ANOVA:
- Find the mean (average) for each of the groups: this should be easy to do by hand (thankfully).
- Find the overall mean: this is the mean for the entire dataset you have.
- Find the Within Group Variance: this is the total variance from the mean of that group for each set of group data, basically the variance of each group (IE the control group, mind control device 1 group, …, etc.), so you will get a single value here (since we’re summing it).
- Find the Between Group Variance: the variance of the total dataset, so the sum of the differences from each sample mean to the mean of the entire dataset (hint: you found the group means in step 1 and overall mean in step 2), again this will return a single value.
- Find the F statistic: the ratio of between group variance to within group variance.
Basically it’s the total (average) variance of all our data compared to the total variance of the group means. Again, we don’t do this by hand because it’s tedious, we’re lazy, and the harder we have to work, the more likely we are to make a mistake. So I plug this data into the software and get a result.
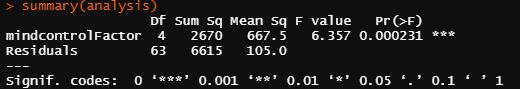
Notice how we have an F -value (follow mind control factor row over to the F-value column), which we covered what that means (here), but Rstudio was nice enough to do two things, the first is give us the probability of a type 2 error, the Pr(>F) column, which is 0.000231 or 0.023%. The second is the *** again, we’re lazy we don’t want to think if it’s significant we want the computer to tell us. The *** significance means the value is close to zero (Signif. codes at the bottom of the screenshot). Sometimes we will even refer to our significance as one, two, or three star significance because of this convention used in software. So we have significance! That will make our mad scientist boss happy and now we’re done… right?
Well based on the information provided, which device(s) worked? We can eyeball the box plot and take a stab at it, but that is the limitation to ANOVA! It doesn’t tell you where the significance is, just that there is significance. We can see why that is if we look back at the steps you take to calculate it, you have a single value for within group variance and between group variance. You cannot tell which group is significant, only that you have one or more groups that are significantly different from each other!
In this case we can’t even say one mind control device is working exactly, we may have no difference between our control group and our devices, but we may have a significant difference between two devices! That may mean that one is causing a large enough reduction in the selected number and one is causing a slightly higher increase in selected number for there to be a difference between the two, but not when compared to the control group! So before we go back to our angry mad boss, we need to figure out where the significance is coming from.
To do that…. we need to wait to tomorrow! I’ll be covering how to determine where the significance is then.
One side note, the ANOVA is one of the main pillars in statistics. Most parametric statistics (the kind we’ve been doing) are just offshoots of the ANOVA and you can already see the f-test kind of jumped out when we were doing this, so it’s good that we covered that! Hopefully tomorrow will have a happy ending for our mad scientist! I don’t know that I can afford to lose this job.


Pingback: The Bonferroni correction in statistics | Lunatic Laboratories