The z-score in statistics

Okay, time to get back to statistics, if only for today! P-value, z-score, f-statistic, there are a lot of ways to get information about the sample of data you have. Of course, they all tell you something slightly different about the data and that information is useful when you know what the heck it is even trying to tell you. For that reason we’re diving into the z-score, it’s actually one of the more intuitive (to me anyway) measurements so let’s talk about it!
I think more people would be good at statistics if we took the time to understand why things are organized like they are. Maybe it’s the mechanical engineer in me, but I just can’t grasp something if I don’t understand how and why it works. I like taking things apart and putting them back together again, so maybe that’s why I’m taking apart statistics these days, to show the inner workings and hopefully make life easier for anyone who needs to use the tools it offers. The thing about statistics is, it looks like magic until you peak under the hood to see why it works. Classes go too quickly to do that, so I decided I’ll do it myself.
The thing about the z-score is a fairly straightforward concept once you understand it. It is just the difference from the mean divided by the standard deviation. We already did a great job defining the mean in this post so if you need a refresher, that would be a good place to start. We also talked a bit about standard deviation, but it’s an important concept, so let’s go over it again.
Let’s say we have 10,000 measurements of rice yields from different spots on a farm. If there is a lot of variation between the measurements our variance is going to be higher. For example if measurements had differences of 1 or 2, that would give you a lower variance than if the differences in measurements was 10 or 20. Also remember standard deviation and variance are essentially the same thing, one (standard deviation) is just the square root of the other (variance)
We never really went into the math behind standard deviation or variance, it was more conceptual than mathematical, so let’s look at the formula behind variance so we can understand how it works.
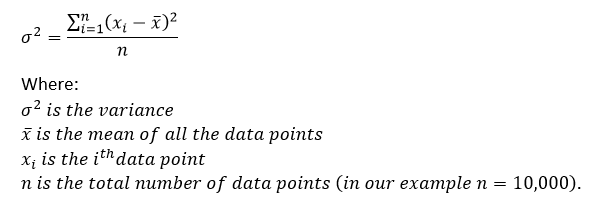
So the standard deviation was just the square root of the variance. That would give us σ as our standard deviation and X̄ is our mean, the mean is also represented by μ (mu) and the effect our standard deviation (again σ, or sigma) has on a distribution is shown below. The larger the standard deviation ( σ ) the wider and shorter our normal curve looks. Remember the y-axis here is probability so a lower standard deviation (or variance) means a higher probability you’ll get the mean.
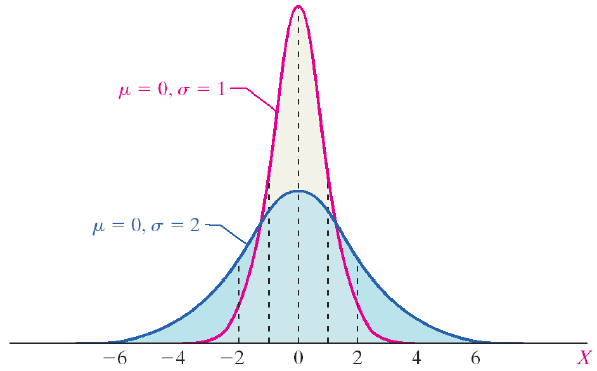
Which makes sense because if the variation of our measurement is high (high variance) then we’re not as likely to get the mean when we take a sample measurement.
This is also why our standard deviation has an effect on our z-score, because the probability distribution changes with the change in σ. So we can determine the probability that our data will fall a certain area ( 1, 2, … n, standard deviations away). Let’s look at this visually so we can understand what we’re talking about:
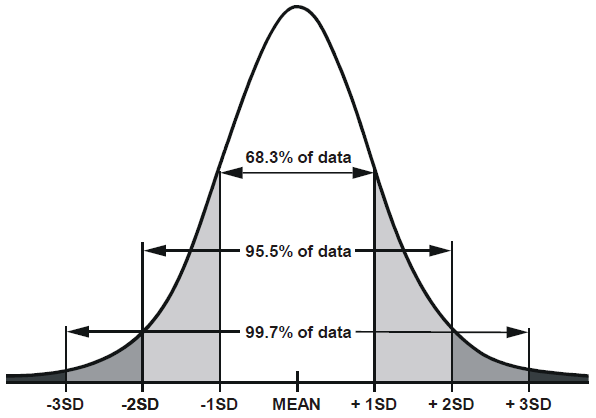
Notice that when we define our standard deviation we can determine how much of the data falls in the range, so if we record a value that is more than 3 standard deviations from our mean, we can say that there is only a ~0.3% chance that the value was caused by chance and not something else. To calculate our z-score we use the following formula

Z-score is really just the number of standard deviations away from the mean we are. So it’s really easy to use and an easier system to grasp (again, in my opinion) than trying to find p-values, although the concepts are related. We can go from z-score to p-value and back again, but it is a more intuitive scoring method because we can use the z-score to tell us where we are on the distribution whereas to find the p-value you need a table to calculate where exactly you are when you’re using something like the t-test.
Actually now that I think about it, we should make a post covering the p-value explicitly for easy reference, so I’ll probably do that next time we dive into the mysterious world of statistics.


you switched mean and standard deviation symbols in the legend.
LikeLiked by 1 person
March 24, 2021 at 11:10 am
Oops! Good catch, thanks for letting me know. All fixed now, hopefully that was the only mistake! That’s what I get for being distracted while writing I guess. Thanks again!
LikeLike
March 24, 2021 at 12:03 pm
Pingback: One-tailed vs. two-tailed tests in statistics | Lunatic Laboratories