Independence in statistics

A while back we introduced the central limit theorem, it was a way to take data and make it normal (gaussian) as if by magic, which is one of the assumptions needed for parametric statistics (the most commonly used kind). Today we’re introducing another assumption, that the data are independent. The idea of independent events is probably straightforward, but it’s yet another bedrock of statistics that we should talk about in depth to help us understand why things are the way they are.
For those of you just joining, this is the “in statistics” series! Every once and awhile I get into a teaching/notebook sort of mood (like with my know your spinal cord series). For this series, we’re talking about statistics, hence the name. More importantly we’re looking at the behind the scenes, the “why” if you will. As in why do we do statistics in the way that we do? Why are the equations the way they are? Why do the equations even work!? Basically the stuff we overlook in favor of teaching you how to apply the concepts. For me, understanding the “why” is essentially the only way I can keep this information in my brain. I’m bad at memorizing equations and when to use them, but if I understand the why then I can at least figure out how to apply them. If that’s you then you’ve come to the right place (hopefully).
We haven’t actually defined it explicitly, but when we use parametric statistics we make some very important assumptions about our data. The first is that our data are normally distributed. That assumption is why the central limit theorem was so important. It’s a tool that let’s us make everything normally distributed. Thankfully the normal (Gaussian) distribution is just about everywhere (numerous biological processes for example are gaussian), which in and of itself is amazing that nature would take that approach.
Today we are going to focus on another assumption. If we’re going to use parametric statistics (which I will define more thoroughly eventually…) we assume each point of our data is independent from every other point. In the last post on variance, I mentioned that uncorrelated data and independent data were not the same. Independence is a stricter definition and we can have correlated data that are independent, but we don’t have independence just because data are not correlated. For that reason, independence is an interesting concept because while it may seem simple, there are pitfalls to assuming independence.
First let’s define statistical independence using some math and then dive into the implications behind it. When our data are independent, we say that they satisfy the following equation:
P(A∩B) = P(A)P(B)
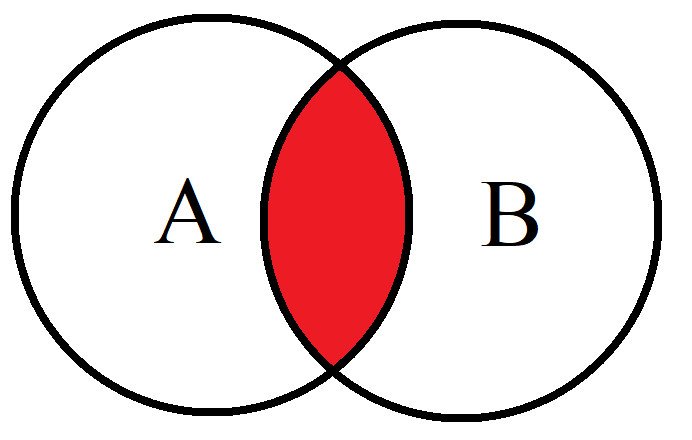
Scary looking equation I know, but we have a n or upside-down u maybe? in the middle of A and B, so let’s start by defining that. The symbol ∩ is our intersection symbol and this can be best shown using a diagram of our events A and B. Below you’ll see my (poor) Venn diagram. The intersection of A and B is the red area shaded in. When our ∩ symbol is facing down like this, that’s intersection. Now when the ∩ symbol is flipped it’s called the union and that’s the whole thing (both circles would be red including the overlap), so don’t confuse the two.
So back to the equation, what we’re saying is that the probability of A — P(A) — occurring after we know that B — P(B) — has occurred is equal to the probability of A happening times the probability of B happening or P(A)P(B). We saw this type of math when we looked at our fair coin example. The probability of getting a heads (H) is P(H) = 0.5 and the probability of getting a tails is P(T) = 0.5 so the probability of getting a heads then a tails is just P(H)P(T) = (0.5)(0.5) = 0.25. This is because the two coin flips are independent of one another.
If that was confusing, then let’s look at a good example of dependence. Hopefully this will be less confusing. Let’s say we have a ball experiment:
Say we have 5 balls in a box, 3 white and 2 black. You draw 2 balls WITHOUT replacing the first draw.
What are the odds that we will draw a black ball on the first selection? This should be pretty easy to figure out it’s just:
P(B) = 2/5 or we have a 40% chance of drawing a black ball the first pick.
Here is where the dependence comes into play, say we do draw a black ball the first pick. Let’s look at what are the odds that we will draw a black ball on the second selection.
P(B) = 1/4 meaning we have a 25% chance of drawing a black ball on our second pick GIVEN we drew a black ball the first time.
If these were independent events the probability of drawing a black ball twice would just be P(B B) = P(B) P(B) = (2/5)(2/5) = 0.16 or 16% and is not what we see here. The odds of drawing a black ball the second time given that we drew a black ball the first time is actually P(B B) = (2/5)(1/4) = 0.10 and that is obviously NOT equal to 0.16, thus we have a situation where we do not have independence. More importantly, if we assumed the events were independent then our model would be bias!
Now, you may be inclined to think that the only time event A and event B could be linked is when we draw from a pool and do not replace the removed value (using our example, removing a ball, then removing a second ball). However, this is why this topic is such an important concept to cover because this isn’t the case. We see dependent events all the time in other context, sometimes in situations where it isn’t always as apparent as drawing balls from a box.
One good example of this is working with EEG data. When we collect the data we cannot assume independence because the data collected is not independent. Why is this? Well for one thing we have to deal with a phenomenon called volume conduction. When we measure EEG signals, we are measuring the changes of electrical potential in the brain, whole groups of neurons, hundreds of thousands at a time. This means several things:
- We cannot resolve single neuron activity using this method
- Because of the way these networks operate, the behavior of one neuron influences the neighboring neurons
- Because the body conducts electricity, the recordings at one sensor will “leak” to another sensor.
Let’s do a quick thought experiment to highlight what volume conduction looks like. If we set several microphones around the outside of a room, and have a group of people talk inside the room, you will see multiple microphones with the same voice at different amplitudes based on how far away the microphone was from the person speaking. This is the essence of volume conduction.
To our point, this means that the data collected is not independent for several reasons and none of them are due to removing something from the system. There are other examples of this concept, but I think that is probably one of the best we can discuss now. So what do we do?
Well the assumption that we have independence is important because as you just saw with the ball example, if we assume independence and do not meet it, we bias our model. The simple solution is to account for this bias and a lot of times in statistics when we say we need IID (Independent and Identically Distributed random variables) we really mean that we need data points to effect one another in ways that we haven’t accounted for in our model. This brings us to something called conditional independence.
Conditional independence is…. let’s call it a less strenuous definition of dependence. Let’s say we have old friends events A and B, but B is dependent on another event, let’s call that event C. We can say that events A and B are conditionally independent given event C (we assume P(C) > 0 or the whole thing collapses back to the original formula we covered above) and our formula becomes
P(A∩B|C) = P(A|C)P(B|C)
This just says that the probability that we have event A occur after both B and C occurred is equal to P(A|C) or the probability of A occurring given C occurred multiplied by the probability of B occurring given C occurred. Examples are probably helpful here so let’s look at a visualization of what we’re trying to solve for. I’ve modified the intersection plot above to include our event C “space” or all the values of event C. Since events A, B, and C are just shapes and not actual values you’ll have to use your imagination, but if events A and B were coin flips then event space A and event space B would be Heads and Tails since those are what we could get out of them.
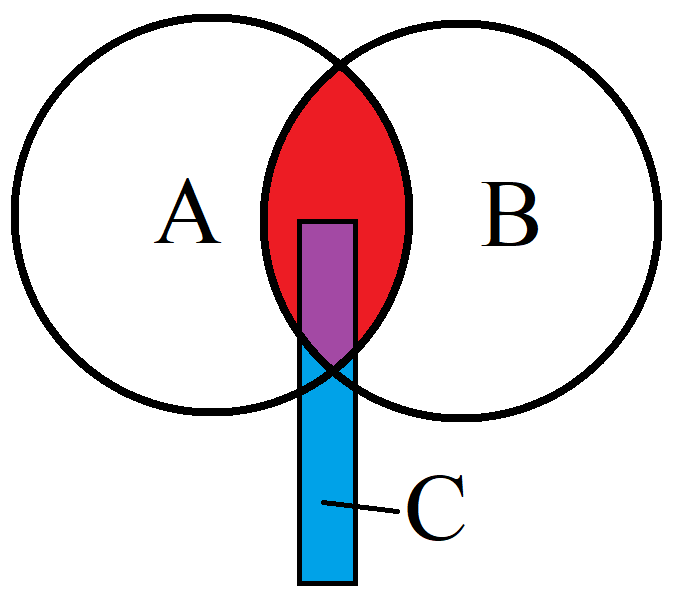
So now we have our event C. Let’s say that A and B are the probabilities of person A and person B getting home at a certain time after work. Now even if person A and B know each other, unless they travel together they cannot impact the others travel time home, so they are independent of each other. More importantly knowing how fast person A got home tells us nothing about how fast person B got home. Now let’s say C is the fact that heavy rain occurred. Let’s say this means that the travel time home would be longer for both person A and B, this still means that person A and person B are independent of each other, even with another variable acting on both of them. Hence conditional independence!
I’ve JUST decided (after spending countless hours making that nice graphic too, haha) that I don’t like the picture above exactly because it suggests that event C will always effect both with the same probably and that isn’t the case, but it’s still a good example and I don’t think we can do any better without getting into even more complicated stuff. This is really just an introduction to the basics and I feel like we’ve gotten pretty far down the independence rabbit hole.
The bottom line about independence and why we need to assume independence (or really account for dependence in our model) is that it causes a bias in our model which in turn gives us false positives or false negatives (the two types of errors in statistics), neither of which we want. We’ve looked at a couple of examples of dependence and independence and introduced the idea of conditional independence, not bad for a single blog post!
We still need to define parametric tests so maybe we’ll dive into that next. I probably should’ve done that already, but the nice thing about a blog like this is that there doesn’t have to be a logical order since all the posts are independent (or at least conditionally independent!) from each other. You can read whatever topic catches your eye, so I don’t need to cover them in a certain sequence.
Until next time!


But enough about us, what about you?