Variance in statistics

Variance, it’s one of those concepts that get’s explained briefly then you find yourself using it over and over. Now that I have a free moment, I figure it’s about time to revisit the “simple” concept and just take a minute to apricate why we have to deal with variance so often and why we try so hard to minimize it when we’re doing experiments. Just like the discussion about the mean, there’s some subtilty that goes into the idea of variance and it’s square root cousin standard deviation and we skip over it in favor of getting into more complex topics.
Yep, we’re back for at least the day with my “in statistics” series. My effort to make sense of the senseless! Okay, statistics isn’t senseless, it just math. The problem is it’s math that we study by glossing over the “why” and jump right into the “how to use.” I think part of the reason is statistics is built on things that are considered fundamentals, we use things like the mean, and variance to solve problems so instructors assume that if you know what the mean is, you know why it works for what your doing with statistics. Around here, we don’t take too kindly to assumptions! Of course I have the benefit of not having a set schedule so I could spend 12 weeks just talking about the mean when you would have 12 weeks for a full course. Think of these posts as supplementary material for people studying statistics, or a good intro for people who (like me) have no idea how that black magic works.
We’re going to do this backwards today and in the end you’ll see why. First we’re going to talk about standard deviation then we’ll jump into variance. They are basically the same thing, but there’s a reason we have both in statistics and not just one. The TL;DR version is that there are equations that only work when you plug in variance, but variance is the square of the standard deviation, so it’s confusing when we’re talking about reaction time for example and say the variance is 9 seconds squared, what does that even mean?
If the world was all the same, statistics would collapse into algebra. However, we live in a probabilistic universe! That just means that no matter how good our equipment is, there will always be slight deviations in our measurements, sometimes we could get 0.00000001 other times we would find the measurement is 0.000000009 (there’s extra zero in that second number, so think very small change). Statistics is our set of math tools to make sense of that randomness, because at the heart of it, even randomness has rules.
So what is standard deviation? It’s just our best estimate of the randomness in our data. Say we want to measure heights of people. If the world was the same, everyone would be the exact same height and we would be done. Instead we have a range of heights for people and depending on age, genetics, etc. so we have an average for “normal” development and some variability associated with it.
Quick side note: the more data points we get the closer we get to the “true” values of the distribution, because really we’re sampling a distribution with properties we don’t know. If we have three height measurements our mean and standard deviation could be way off from the actual mean and standard deviation of the population (all the things we are measuring, in this case heights of everyone on the planet). Think of it like taking a glass of water from the ocean and declaring there are no fish in the ocean based on that single sample.
This is important because in most cases we don’t know the “actual” values for the variance and mean in our population, but if we have enough samples statistics says we can get close to those values. Now that we’ve covered that little warning, let’s just look at the formula to calculate standard deviation and then we can talk about why the math works the way it does. The equation for standard deviation ( σ ) is:
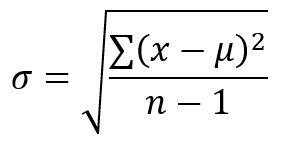
where mu ( μ which I remember as the u with the tail in front) is the mean, we’re summing (the backwards E looking thing which is capital sigma and is the symbol in math for summation or adding everything together) the square of the difference between the value x and the mean value for the data we have. If our data was 1,2,3,4,5,6 our mean would be (1+2+3+4+5+6)/6 = 3.5 and so our x value would just be 1,2,3,4,… or 6. We square it so it’s all positive so 1-3.5 for example is -2.5, so we square it to get rid of the negative and to eliminate the square operation we take the square root at the end. That covers everything but the bit at the bottom, n-1 our evil little friend. n is the number of samples we have and we use n-1 because this is a “second order” property of the data. To compute it we need the mean of the data so think of subtracting the mean as removing an invisible sample point in our data. We correct for removing that by dividing by n-1 instead of just n like we did for the mean.
This gives us the average of the differences, or the standard deviation. So standard deviation is just the average spread out our data is! Easy and time to go home. Yes I already made that same joke with the mean discussion, sue me. The standard deviation is a powerful tool because as we saw when we talked about the normal distribution, we only need standard deviation (or variance) and mean to describe the entire distribution! Standard deviations are also useful because we use them to measure how far away we are from our data. ~68% of our data (when the data are normally distributed!!!!!) fall within 1 standard deviation (plus or minus), illustrated in the graphic below from a previous discussion on our one tail vs two tail tests. So a large standard deviation means a large range of values, while a low standard deviation tells us our measurements have a very tight range of values.

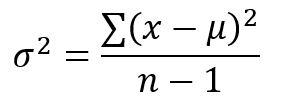
The variance formula on the other hand is the exact same formula, but without the square root, so we represent it using sigma squared (the circle with a hat bill or however you want to think of sigma, this guy: σ ). It just shows that they are the same value and even if I give you σ = 3 you can calculate that σ^2 is 9 by squaring the value (3^2 = 3*3 for completeness sake). In short, the formula for variance is just:
Now this is all (hopefully) straightforward, but have you ever wondered why we even have two different values? I mean standard deviation seems simple to understand, it’s in the same units as whatever your measuring so if I give you the standard deviation of a measurement using the information I’ve given you should be able to understand that a smaller value means your variability of your measurement is low, how low depends on the value. However if I give you variance, the units are now squared (like above when I said what the heck is a second squared mean). The short answer to why we even have variance is because of math.
The sum of random variables (distributions that are uncorrelated, which is not the same as independent! Independence is a stricter definition) also has a variance that is the sum of the variances of those distributions, so they all add together nicely. You can’t do this with standard deviation though, so we rely on variance for our math stuff. So why use standard deviation? Well standard deviation has the convenience of being expressed in units of the original variable, so it makes more logical sense.
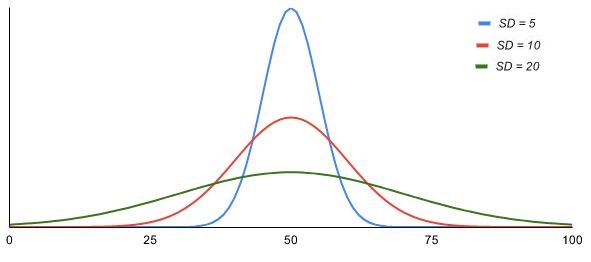
That’s sort of the thing that gets skipped over a lot that doesn’t make sense until you look into why it’s even a thing. Variance is needed because it makes math easier, but standard deviation is easier for you and me to understand, which is why we are stuck with both! Luckily the symbols for them remind us of their relationship, because everyone is lazy and no one wants to have to memorize formulas so we do little things like that to make it easy to keep track of what’s related to what (hint for people studying math/statistics/physics/etc.). One last thing, we mentioned this above, but below is a visual for how the normal distribution changes as the variance (or standard deviation) is increased. You’ll remember that your y axis is from 0 to 1 (the curve never actually reaches to 1 since the area under the curve sums to 1 or 100%) and is the chance your value will end up within a certain range, as your variance increases, your chances of getting a value close to the mean (50 in the example below) start to drop pretty rapidly. This is why (in neuroengineering at least) we like our data to be very low variance if we can help it.
Was this far more information than you could ever probably want to know about variance and standard deviation? Sure, but if you’ve ever wondered why the heck we use the two variables so much when they are basically the same thing, hopefully the read was worth it!


But enough about us, what about you?