One-tailed vs. two-tailed tests in statistics
Sit right back because we’re telling a troubling tale of tails full of trials, twists, and turns. The real question is, will we run out of words that start with t during this post? It will be tricky, but only time will tell. When do we use a two-tailed test vs. a one-tailed test and what do tails have to do with tests anyway? With a little thought, I think we can tackle the thorny topic. In short, let’s talk tails!
As if statistics wasn’t difficult enough I find myself stuck trying to use as many words that start with “t.” Stupid joke, I know. So a quick reminder about what the “in statistics” series is all about. Ever sit in class and learn how to do something without knowing why it works? It’s like teaching addition without explaining why math works that way, yet we do it all the time when you get into higher education and need to cram complex topics down into 10-12 week chunks. In statistics, you get taught the math behind the test, but never why that math works. I have a BS and MS in mechanical engineering and if I don’t understand how something works, I take the damn thing apart until I understand. That’s essentially what we’re doing here, taking apart a small bit of statistical magic and showing you why the inner workings are the way they are. My favorite so far? My post on the mean. It’s such a simple thing, but we saw it was the linchpin in parametric statistics, which require you to have a normal distribution for the math to work.
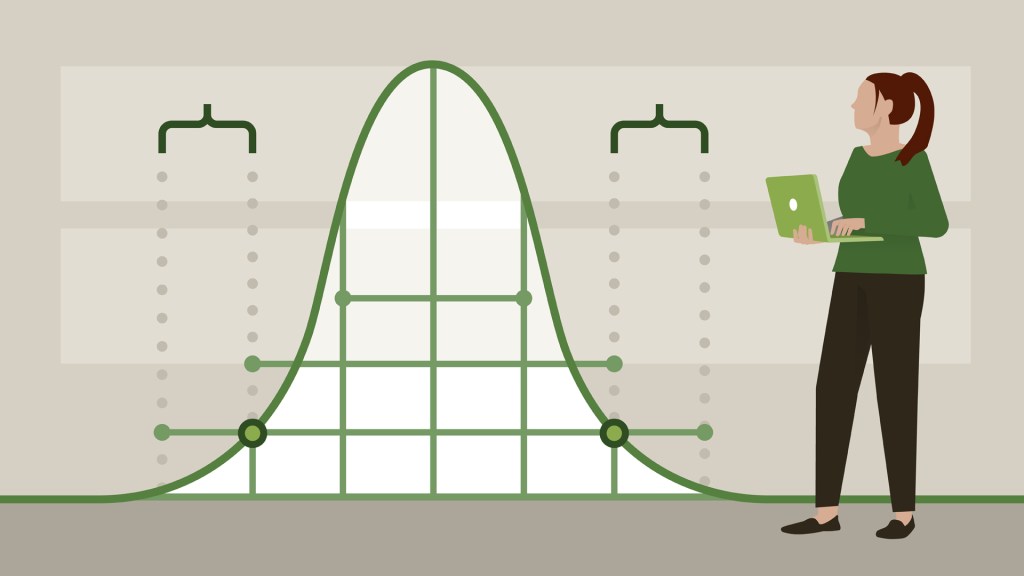
Well I promised a tale of tails so let’s get to the topic. The normal distribution is probably the best known distribution around. Even if you’re not familiar with statistics, chances are if you see it, you know what it is. Turns out the normal is our preferred method for statistics and we’ve basically built a whole field around it (parametric statistics), not to be outdone, we do have something called non-parametric statistics which as the name may imply does not require you to have a normal distribution so you don’t even need to check when using those tools, nice right? Okay, so below is our normal distribution, nicely bell shaped.

Remember the y-axis (the up and down axis) is our probability that you will end up that value of x. The x-axis is your x value, which is the value you measured so the x-axis units are whatever units you’re using. For example fi you’re measuring weight, your x-axis units could be in lbs (if you’re in the backwards US) or kg (for everyone else basically). The area under the curve sums to 1, which is 100% and is our total “problem space” or just every possible measurement you could get from negative infinity to positive infinity. Notice that the tails (the ends of the distribution) don’t touch the x-axis and technically the never do! They go off to positive and negative infinity. The chances of you getting an infinite weight measurement are zero, but the math requires us to look at the full “problem space” to properly estimate the likelihood.
Since our mean is the highest point, the chances of our measurement being the mean or very close to is is high, in fact it’s the highest you can get, but it isn’t 1 ( because that would mean you had 100% chance of measuring the mean and that never happens unless your variance is zero and why are you even doing statistics with the data at that point? The highest point is about 0.4 or ~40% in case you’re interested in that. To be even more “formal” or maybe just give a visual, I’ve labeled our “tails” in the picture below.

Above you see that we have an upper tail ( the tail on the side with the positive standard deviations) and a lower tail (the tail on the side with the negative standard deviations). We also see where the bulk of the data falls so you have a 68% chance of ending up somewhere between -1 and 1 standard deviation from the mean, so if the mean was 6 and 1 standard deviation was 2, you would have a 68% chance of finding a value between 4 and 8 (unitless since this is just an example). If the standard deviation was 3 then you have a 68% chance of getting a value between 3 and 9 (more on standard deviations). Now there’s no real cutoff for “where” the tail is, it’s just that side of the bell curve and we call it the tail because it looks like a long tail, remember it goes off to infinity and never actually touches the x-axis!
Now that we know what the tails are, let’s talk about a one-tailed test first, then we will give an example of a two-tailed test. A one-tailed test looks for the probability that your value above or below a critical value, but NOT BOTH! This is best explained with an example. Say we’re interested in seeing if a new method of teaching improves test scores. This is a one-tailed (upper tail) test because we’re only interested in seeing if the new method improves the scores, not if it makes the scores worse. So we do the work and get a value x, this x could be the t-score value, it could be a z-score doesn’t matter where it came from.
The test we’re doing is a one-tailed test, so we are looking at the probability that the value x could be drawn from our population. So what we’re really doing is looking at the probability that we could draw a value from negative infinity to x (or as X approaches x really). Graphically it looks like what I have below. We’re suming the area under the curve from negative infinity to x (shaded in red), if that value is greater than or equal to 0.95 (in this case we’re saying we have an alpha of 0.05 or a 5% chance of a type one error).
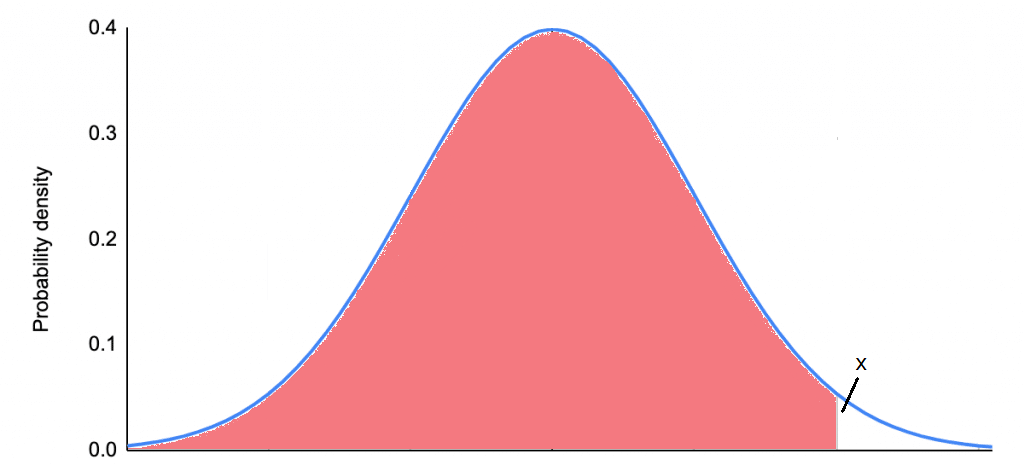
You’ll notice that means the unshaded area is at maximum 0.05 of the remaining area under the curve or less than or equal to 5%. We call the 5% mark (when we set it there) our critical value and that’s why sometimes when we use a t-table we find the value corresponding to our alpha to determine if we’ve hit our critical value. Once we set our alpha (again, chances of making a type 1 error), our critical value is set for us, so if our x value is larger then it doesn’t matter how much larger, we’ve already surpassed our threshold.
So that’s a one-tailed test and to recap when we use a one-tailed test we are interested in the probability that our value is significantly higher (or lower, but we did higher in the example above), but NOT BOTH! Also, if x was our critical value (instead of our measured value), the unshaded portion of the distribution would be 5% or 0.05 of the probability. The test scores example was good because we only cared about improvements, but now let’s look at an example where we would want to use a two-tailed test.
Say you are a peanut butter manufacturer and want to make sure that your jars are being filled within a certain tolerance. In this case we’re using a two-tailed test because we want to find the probability that our measured value is significantly lower or higher than the mean. In this case, if we wanted our machine to fill the jar to 8 ounces, our mean would be 8 ounces, I won’t go into the math beyond that, but I figure it would be good to give at least the basic information. Now we take a bunch of samples and we want our alpha again to be 0.05 or 5%, to do a two-tailed test we need to look at the probability that we fall within a range of values, no longer negative infinity, we’re looking at a -x to +x, shown below.

So let’s say that our critical value is x now. The last example I said that the unshaded area at x was equal to 0.05, but since this is a two-tailed test we divide that in half, so the total unshaded probability area (area under the curve) is 0.05 or 5% and the probability area in the lower tail only (or upper tail only) is 0.025 or 2.5%. When doing a two-tailed test the critical value higher (in the positive direction, it would be lower in the negative direction or more negative) because we no longer have the probability concentrated on one just one-tail. (EDIT: Okay, I just realized the above image isn’t quite symmetrical, in real life and not my horrible drawing it would be symmetrical!)
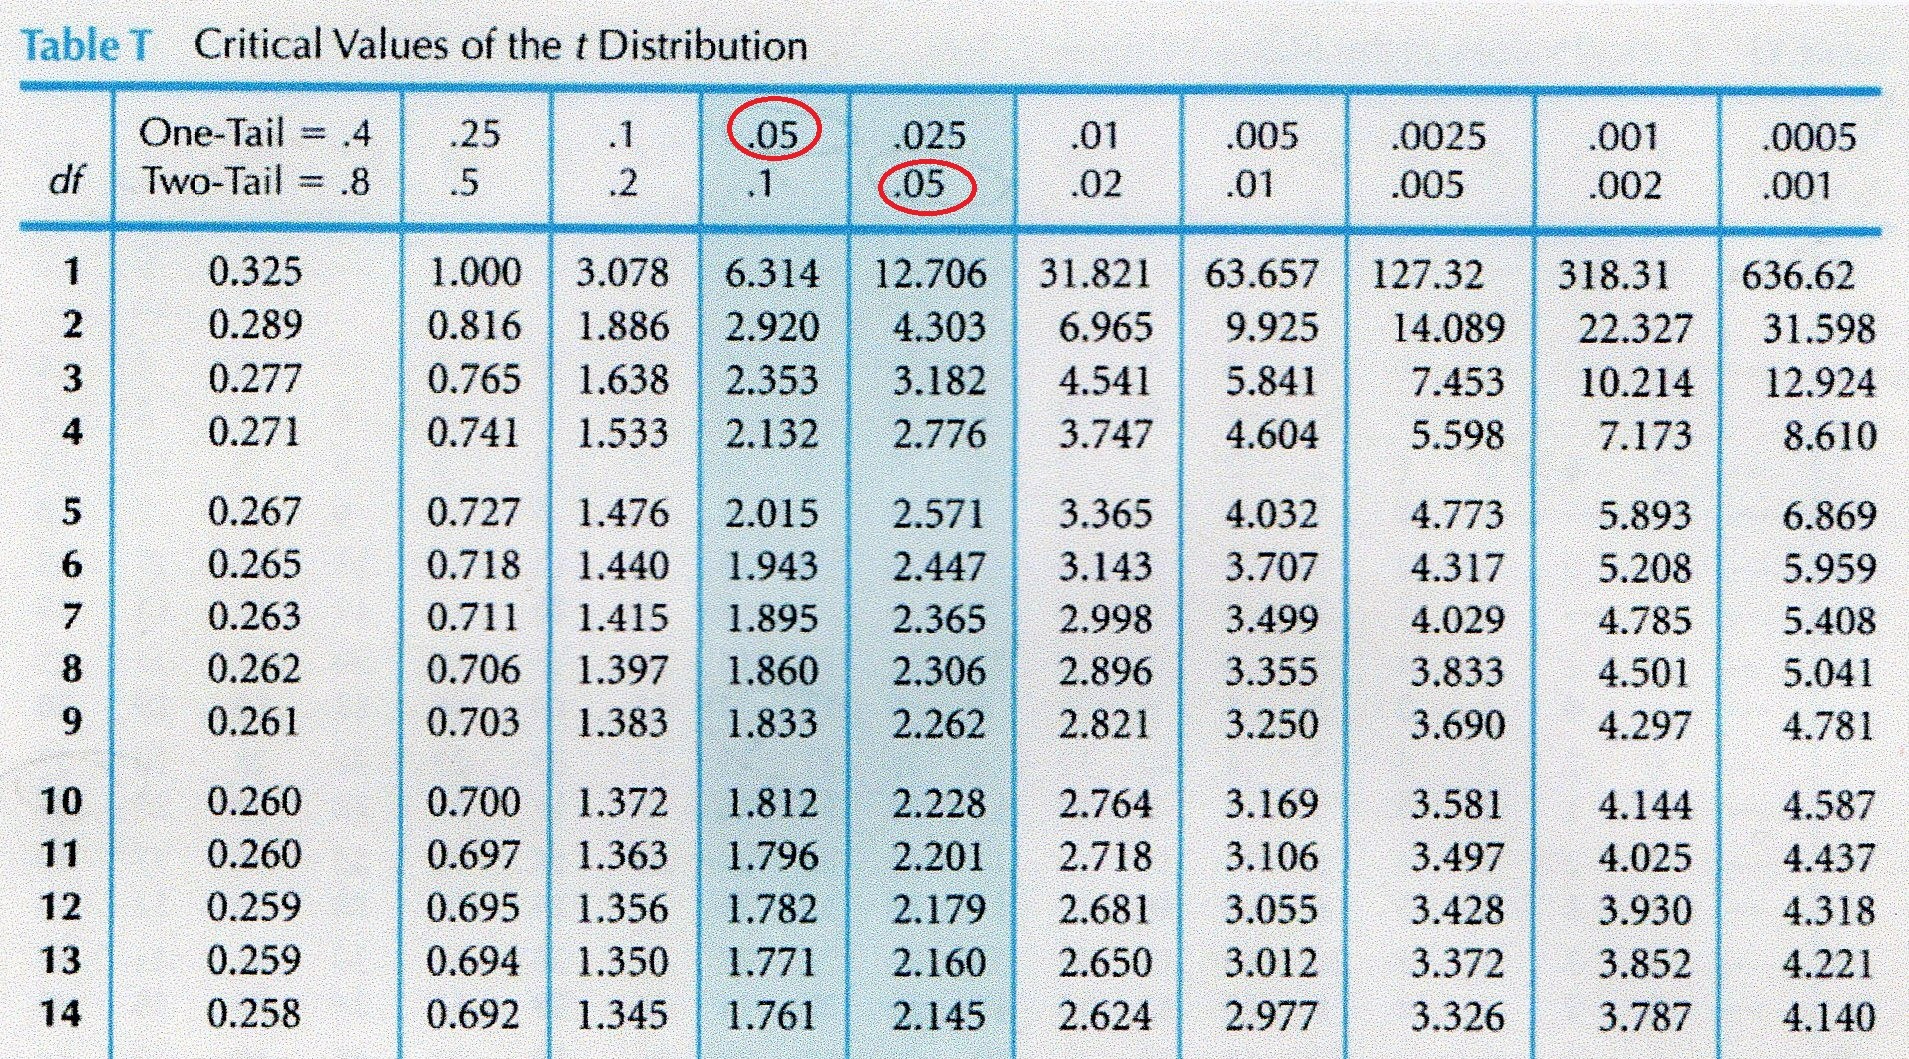
When using a t-table for example you can use a one-tailed test for both a one-tailed and two-tailed test. However, you can use a one-tailed table for both one-tailed and two-tailed tests, you just need to adjust your alpha accordingly when finding the critical value. How do you remember that? For a one-tailed test if you want an alpha = 0.05 it’s just alpha/number of tails so 0.05/1 = 0.05, but for a two-tailed test it’s 0.05/2 = 0.025. That’s why if you ever use a t-table they group one-tailed and two-tailed tests, see below. Notice the red highlighted area is for alpha 0.05 for a one-tailed test and in the next column it’s 0.05 for a two-tailed test, but 0.025 for a one-tailed test. It’s the same value, you just have to adjust the critical value if you use a one-tailed table. Thankfully most tables will be like this and provide both because of the symmetry of the values, but not always!
Now how do you know which test to use, a one-tailed or two-tailed test? If you want to know if your sample is significantly different from the mean, but you only care about it in one direction (larger or smaller), you want a one-tailed test. If you want to know if your value. If you’re interested in finding out if your value is significantly larger OR smaller than the mean, put another way you care about both directions, then you want a two-tailed test. Sometimes it’s tricky to tell which test you want to use, I like to think about it in terms of directions. If you only care about one direction it’s a one-tailed test, if you care that your value is significantly different in both directions, then you need a two-tailed test.
Again, sometimes it can be tricky to tell which test you need, but hopefully now that we’ve covered the differences it will be easier to tell!


I had to chuckle when you mentioned about taking something apart to figure out how it works. It’s funny as a parent I remember being okay with my kids taking things apart. A teacher once said that children are the first scientists (without even realizing it) so even though I cringed at things I would have to toss in the garbage, it made me smile on the inside that they were learning (some what).
thanks for sharing your brain 🙂
LikeLiked by 1 person
March 26, 2021 at 1:10 pm
What an awesome story! You’re such a great parent!! I never grew out of the taking things apart phase (obviously), but I’m happy about that. Take care!
LikeLiked by 1 person
March 27, 2021 at 11:39 am