Errors in statistics
Everyone makes mistakes, that’s okay! In day to day life there are a lot of different ways you and I could make mistakes. In statistics however, there are just two ways for you to make a mistake. That may sound like a good deal, but trust me when I say two ways to make a mistake is two too many. To think, you spent all that time picking the right statistical test, did the experiment, analyzed the data, just to make an error in the end. Don’t worry, it happens to the best of us, but knowing what they are will help you prevent them!
Welcome to the statistics miniseries portion of my journey. If you’re just coming in, welcome! I’m a third year PhD candidate in neuroengineering. I’m studying how spinal cord injury changes communication to and from the brain. I’ve got a couple of years left (depending on who you ask) and this is my second year of daily blogging so there is probably more information here than you could ever want about the first couple of years in a neuroengineering PhD program. Yesterday I said we would cover errors that you can make in statistics and that’s what we’re going over.
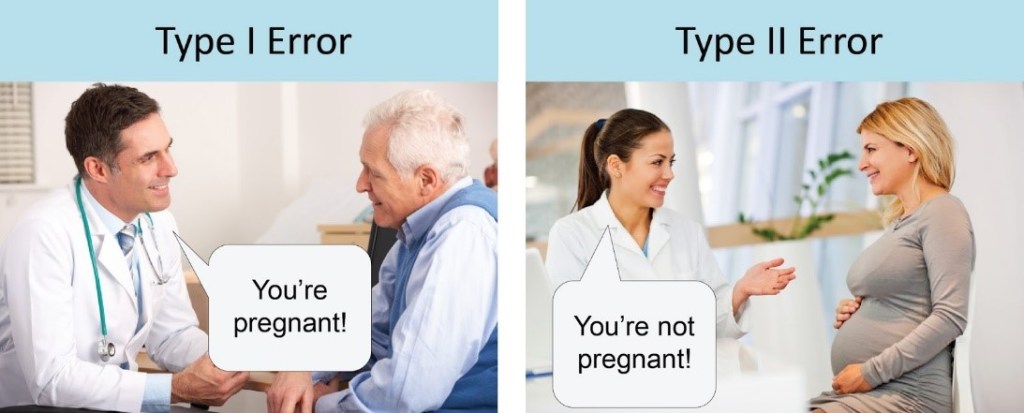
As the photo in header suggests, a type 1 error is a false positive! Back to the coin example from yesterday, it would mean that we claim our coin is unfair when, in fact, it is a fair coin. This can happen for a lot of different reasons. A small sample size can cause a false positive, say we only flipped a coin 3 times and got heads all three times. That would be a somewhat low probability of occuring, but it can and may happen.
Another issue may be confounding factors that weren’t accounted for. For an example, say we flipped the coin in such a way that it never spun and always landed with whatever side was up when we “flipped” it, that would be a systematic error that we didn’t control for and we bias the experiment either unintentionally or maybe we did it on purpose, you never know. Confounding factors are simply things that influence the outcome of the experiment, which is why experimental design is so important, so that we can identify then and either control for them or take them into account when we do an analysis.
One other example that may lead to a type 1 error is if we set our confidence interval too low. Yesterday I touched on what a confidence interval is, but it’s literally the percentage chance that the conclusion we drew was incorrect. Normally people will have a 95% confidence interval, that’s the most common (in my field anyway) and that means there is a 5% chance that the result we got was due to chance.
If I flipped a coin 10,000,000 times and got all heads, even with a 95% confidence interval we still have a 5% chance that our result was due to chance and there is a non-zero chance that we could get all heads from a fair coin! Even though that chance is extremely tiny and practically zero. If we set our confidence interval to 95% we allow for a 5% error no matter how many times we sample (flip the coin) so our bounds (the confidence) interval changes depending on the number of flips. If we flip a coin 10 times for example the values we get for our 95% confidence interval or the range of outcomes we would expect for a fair coin, would be let’s say between 4-6 heads in this case (that is a number I just made up, not the real confidence interval!) if I flipped it 10,000,000 times our 95% confidence interval may be that we would expect between 4,999,900 and 5,000,100 heads (again totally made up values here!) so something to keep in mind as we have this talk.
At this point maybe you’re thinking, let’s crank that confidence interval up! Heck, let’s get 99.9999999% confidence in our data! That way there is almost no chance that we would have a type 1 error. And you know what, you would be absolutely correct, but there is a couple of good reasons we don’t do this. The first is the amount of data we would need to have 99.9999999% confidence. That’s a whole lot of data to be that sure that your coin is either fair or bias! You may need all 10,000,000 just to figure that out (as before, just making an example not the actual number of flips you would need).
The second problem with a 99.9999999% confidence interval is that you dramatically increase your chances of making a type 2 error! A type 2 error is a false negative, or we say the coin is fair even though it is really bias. The higher you crank your confidence interval the more likely you are to make a type 2 error. Sometimes we’re okay with the risk, like in physics they use a five sigma (five standard deviations from the mean value) confidence interval which gives a 99.99997% confidence that what they found is correct. They do this because you want to be absolutely sure that your findings are correct. You would rather miss finding something than say you found something when it turns out to be false.
This isn’t to say that type 2 errors are preferred, just that in a lot of cases you would rather miss something than claim something that wasn’t real. In engineering, or in my case neuroengineering, we’re okay with a 95% confidence interval. In fact, 95% confidence is usually the standard, sometimes we go as high as 99% or if it’s really serious work, 99.9%. We rarely go higher, as in I literally can’t think of a case in the engineering side of things for this. The difference in standards between neuroengineering and physics is partly due to the effect size. We’ll talk about effect size tomorrow since it deserves its own post.
Now that we know what types of errors we can make and what they mean, we’re almost ready to dive into how we run a statistical test! Almost… there are still a handful of things left to cover, effect size for one, but also something called the central limit theorem and it’s essentially the cornerstone of why we can do the statistics we do! Then we’ll dive into solving a coin flip problem just for fun, because that’s how we have fun around here.


Pingback: One-tailed vs. two-tailed tests in statistics | Lunatic Laboratories
Pingback: The Bonferroni correction in statistics | Lunatic Laboratories