A fair coin in statistics

It has been a busy day, but the show must go on so to speak and I’m here today to tell you I have a nice shiny new coin for us to flip! The catch you may ask? Well it could be a fair coin or I may have just swapped it out for a coin that was not fair! Our goal is to see if I’m being sneaky and to do that we’re going to need some statistics!
It’s all coming out math this week. Yep it’s another round of “in statistics” where I show you the why. As in why things work the way they do and hopefully demystify the dark art of statistics in a way that makes sense (at least in my case!). So far we’ve introduced the idea of a hypothesis, the types of errors you can make, effect sizes, and lastly the central limit theorem. Essentially we’ve covered the bare minimum to understand what we’re going over today!
First, we should state our hypothesis, in this case it’s pretty simple, but it may not always be that way. More importantly it frames how you solve the problem and we can talk about that in a minute, but first let’s figure out our hypothesis. The null hypothesis is our “boring one” so that would be that the coin is fair, since most (technically all) coins are fair. Our alternate hypothesis is that we have a sneaky coin and it’s not fair! (see the hypothesis post for that refresher)
Now we need to select our confidence interval, or our significance level, I prefer confidence because it’s literally how confident we are that our answer isn’t by chance. Normally that is 5%, but sometimes it’s smaller, like 1%, or even lower. (see the types of errors post for why this is important!). Since we’re doing this for fun, because we like to have this kind of fun around here, we’re going to use a confidence interval of 95% so we have a 5% chance that our result was due to pure chance.
Okay, so let’s do the experiment…….. *bing* experiment is done! That’s the magic of the internet we can do experiments super quickly. You’ve flipped the coin 1000 times! Besides needing to see a doctor about the numbness in your thumb after so many flips we can figure out if that coin is fair or not. Let’s say that we got 528 heads and 472 tails, first we should determine the population statistics, which as we discussed are going to be approximately normal. (see the central limit theorem post for more).
The mean is easy, we expect a fair coin to have 50/50 so if we call heads successes, we would have 500 successes in a perfect world (1000)(1/2) = 500. The standard deviation is a little more complicated, but is the square root of the number of trials (n) the likelihood of success (p) and the likelihood of failure (q) since wordpress doesn’t like math, here’s the visual version:

Now this is for the binomial distribution, which is why we have successes and failures to begin with, buuuut like we said we can approximate the binomial as a normal and the math works out just as well. So now we know our mean (500) and standard deviation (~16), but need to pause for one second and talk about the normal distribution and how many standard deviations away constitute a 95% confidence.
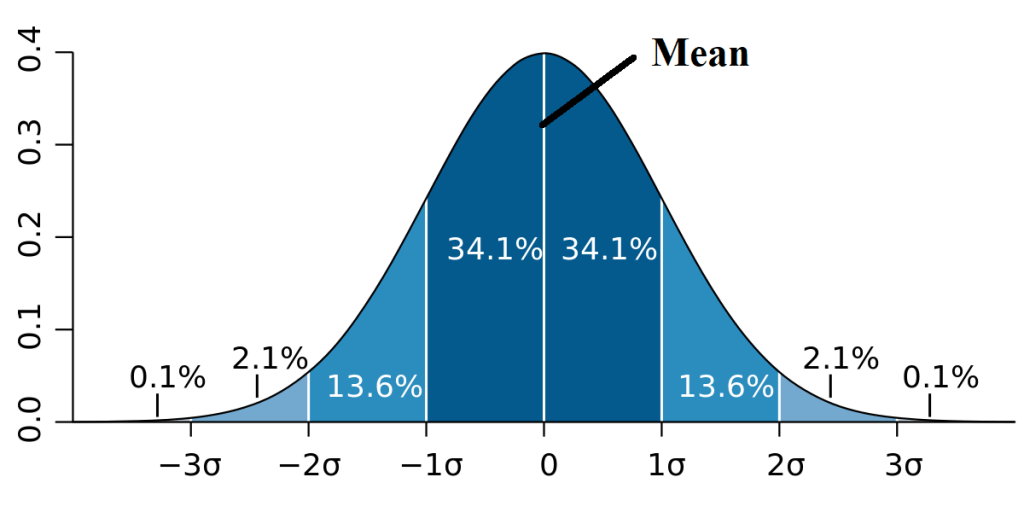
The rule goes like this, 68-95-99.7 which means 68% of the data should fall in the first standard deviation, 95% of the data should fall within two standard deviations, and a whopping 99.7% falls in three standard deviations from the mean. This isn’t exact, but it’s close enough for most thought experiments, you can do the math though and figure this all out, 95% is actually 1.96 so ~2 standard deviations away
In this case we can use another formula to determine the likelihood that we would get 530 or more flips we sum all the combinations that give us that amount, so for example let’s say we only flipped the coin 5 times, we could get 3 heads several different ways, it could be H,H,H,T,T or maybe H,T,H,T,H and so on. Thankfully we can solve this via math and that looks like this
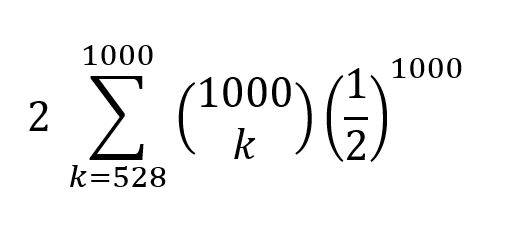
This says that the probability of getting the result we got is 2 times (because we need to account for both directions or 528 tails basically, since we’re interested in if the coin is bias in either direction) the summation (that’s the E looking thing), between k = 528, our lower limit and 1000 our upper limit, which is why one is on the bottom and one is on the top! That’s just the convention we use, so we plug in every value from 528 to 1000 and do the math to figure out how many times we would end up with at LEAST 528 heads. So what’s with the numbers stacked? That’s the convention we use, but if we write it out it looks like this.
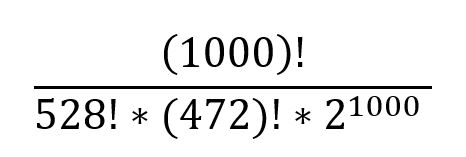
Basically it’s just a more compact way of writing it out because, well look at how much space this takes written out, were lazy who writes that much? Now doing this by hand is… well not very practical so we can use a calculator to give us the answer and we get.
P = 0.08194…
The p-value is your probability value so the chances that we would get 528 heads or more, by chance is ~8.194%! Which means we cannot say that this coin is not fair. In short we cannot reject the null hypothesis and say the coin is fair. This is why we set our P-value (the confidence interval) beforehand, so we don’t bias our result. If we wanted a 99% confidence interval for example, we would say the coin is not fair! Or if we wanted to be sneaky we would start with a 99% confidence interval (CI) and change it to a 5% CI then we would head to vegas and try our luck.
You may wonder what the standard deviation had to do with all this (obviously I didn’t use it in this to calculate our result), but we can look at the value at the 95% confidence interval (in both directions) to figure out if the value fell in that range. However, 2*16 is 32 and our result falls within the range so it’s an easy way to double check our result and make that everything matches up, if it didn’t we would need to double check our work. In fact, if I set my value to 532 heads, we get a p-value of 0.04629 or only 4.62% chance that this coin is fair and we can reject the null hypothesis in that case (remember we rounded up for both the standard deviation and confidence interval, so this makes sense even though we’re right on the edge).
So that’s it, we had a fair coin after all! Maybe I’m not the evil genius I think I am, my gambling career has ended! And I would’ve gotten away with it too if it weren’t for you statistics! Curses!!


But enough about us, what about you?