Day 24: The z-score
So if you recall from last post… well I’m not linking to it. It was hellishly personal and frankly I’m still attempting to recover from it. We’re going to take it light this time and we can do a deep dive into something in another post. For that reason, let’s talk about z-score and what exactly it is, I mean we used it in this post and never defined it formally, so let’s do that. Let’s talk z-score!*
In the post I just referenced and linked to, we used something called p-value and something called z-score to determine the significance of our data. In that example we had a coin we flipped to test if it was bias or not. When we finished the experiment (no spoilers) we used the p-value and z-score to find out if our coin was bias. Unfortunately, it was already three posts long at that point so we did a bit of hand waving and said p-value and z-score are important and linked, but that we wouldn’t talk about them until some other time.
Z-score is a fairly straightforward concept once you understand it, it is the difference from the mean divided by the standard deviation. We already did a great job defining the mean in this post so if you need a refresher, that would be a good place to start. We also talked a bit about standard deviation, but it’s an important concept, so let’s go over it again.
Standard deviation is the square root of the variance, we discussed the variance and the math behind standard deviation in the post linked above where we also talked about the mean. In case you missed it we said that the variance was defined by:
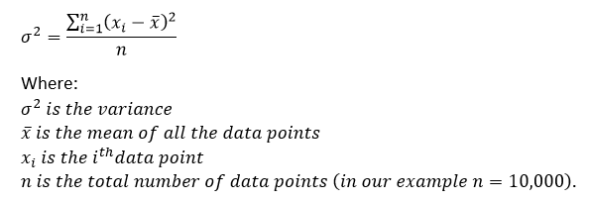
So the standard deviation was just the square root of the variance. That would give us σ as our standard deviation and X̄ is our mean, the mean is also represented by μ (mu) and the effect our standard deviation (again σ, or sigma) has on a distribution is shown below.
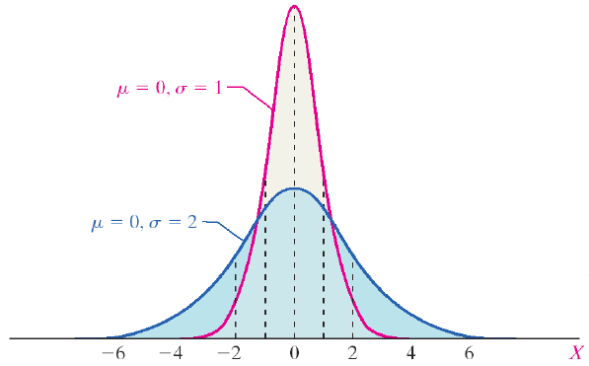
Same normally distributed data, same μ (mean), but different σ (standard deviation)
This is why our standard deviation has an effect on our z-score, because the probability distribution changes with the change in σ. So we can determine the probability that our data will fall a certain area ( 1, 2, … n, standard deviations away). Those plots normally will look something like this:

Notice that when we define our standard deviation we can determine how much of the data falls in the range, so if we record a value that is more than 3 standard deviations from our mean, we can say that there is only a 0.3% chance that the value was caused by chance and not something else. To calculate our z-score we use the following formula
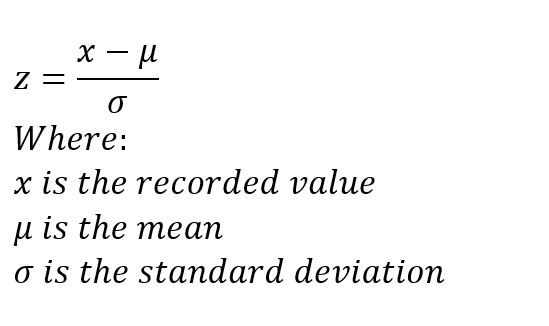
Z-score is really just the number of standard deviations away from the mean we are. So it’s really easy to use and an easier system to grasp (in my opinion) than your p-values, although the concepts are related. We can go from z-score to p-value and back again, but it is a more intuitive scoring method.
That seems like enough for now. We’ve covered what might be argued as basic topics, but everyone starts somewhere and it’s important that we cover these things so no one gets left behind. This should be accessible to anyone, no matter the background. So next time, we talk p-values and compare p-value to z-score.
Until next time, don’t stop learning!
*As usual, I make no claim to the accuracy of this information, some of it might be wrong. I’m learning, which is why I’m writing these posts and if you’re reading this then I am assuming you are trying to learn too. My plea to you is this, if you see something that is not correct, or if you want to expand on something, do it. Let’s learn together!!


But enough about us, what about you?