Day 15: Significance, Part 3
Where does our observation fall on the probability density function?
It looks like we’ve arrived at part 3 of what is now officially a trilogy of posts on statistical significance. There is so much more to say I don’t want to quite call this the conclusion. Instead, let’s give a quick review of where we left off and we can get back to determining if an observed value is significant.*
For those of us joining us, you may want to start at the beginning with Day 13. If you need a reminder of what we covered last post you can read that here. Let’s do a quick recap so that we can get into it.
Essentially we were handed a coin and we wanted to determine if this coin was bias so we created an experiment to test this. We knew intuitively that because we had two choices (heads or tails) if the coin isn’t bias we should see ~50% heads and ~50% tails. We also said this wouldn’t be exact because of randomness in the flip (IE wind, the way the coin is being held prior to the flip, etc). We also said that since there is this randomness we would do 10,000 flips to give us a really large sample size.
In reality we could have determined how many tosses we needed to figure this out, but we decided to play it safe and leave how to determine how many tests we needed for a later post.
We flipped our coin and after our 10,000 trials found that we had 156 more heads than tails. Ah ha! Bias coin… right? Well maybe, but how do we be sure that it is bias and isn’t just the randomness involved in the flip? That is what we mean by significance!
Then I simplified it and showed that if we had 5 separate trials we had 32 possible outcomes (2^5 or two to the power of 5). Then instead of writing all those out we agreed to cut it down to just 3 trials which gave us 2^3 = 8 outcomes. Much more manageable to write out and we brought the list over for this post below (where H is heads and T is tails):
- HHH
- HHT
- HTH
- THH
- HTT
- THT
- TTH
- TTT
This was our entire probability space written out. We played around with it and came up with the math to explain it (because writing out all the possible outcomes for 10,000 trials would be … not fun). We showed that:
p(k, n) = (1/2)^n C(k,n)
Which brings us up to speed and now we can talk about…
Significance (finally)
We now have some math to help us solve the mystery of our coin outcome. Or more importantly we have the math to determine our probability density. That is to say, how many ways can we flip a coin 10,000 times, this covers the entire probability space from 10,000 heads,exactly 50/50 and back to 10,000 tails. However, if you recall there is exactly 1 solution for 10,000 heads or 10,000 tails, making either of those HIGHLY unlikely. Using our 3 coin flips example we showed that there was 3 ways to create a 2 heads and 1 tails outcome, which we also showed was three times more probable. This is the essence of the probability density function. So let’s define a few helpful terms and we can get to solving this mystery once and for all.
Mean, Variance, Standard deviation
First up is mean. When we say any of these, we mean something very specific. The “mean” of a set of numbers is just the average. To get the mean, we just sum the number of heads (in this case) and divide by the total number of trials. This would give us the mean number of heads.
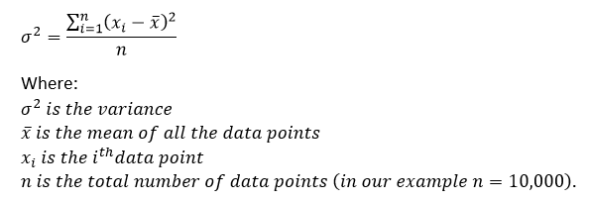
This leads us into variance. Variance is the spread between numbers in our experiment. What it does is measure how far away a number is from the mean of the data. To find it we subtract the data point from the mean of all the data points. Then we square that number, repeat this process for each individual data point, then sum them together. Next we take that number and divide by the total number of data points. Why square difference between the mean and observed value? So we don’t have to deal with negative numbers in our summation. If that is confusing without seeing the formula, you’re in luck because I made an image for it so I don’t have to try to type it out using limited characters, here it is:
Lastly, we can talk about standard deviation! This one is easier to cover, the standard deviation is just the square root of variance. This gives us a measurement of how far away from the mean we are. If the data points are further from the mean, we are said to have a higher deviation within the dataset. Therefore, if our dataset is more spread out, we have a higher standard deviation.
Now we are ready to put it all together and find our answer.
If you recall, I said that one of the assumptions in parametric statistics is that we have a normal distribution. A normal distribution looks like this:
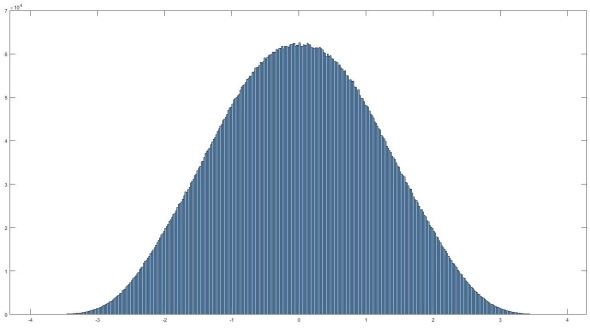
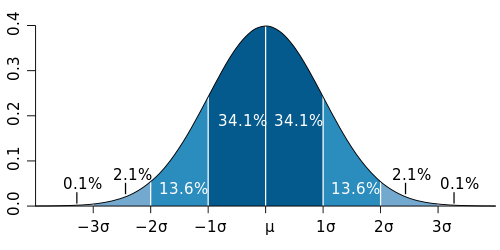
This is a visualization of our probability space and is called the probability density. It is a visualization of how likely we are to find a certain value, in our case it will tell us how likely we are to see 156 more heads than tails in 10,000 flips. Right now it is tough to read so we can segment this by the probability that our value falls in a certain range. That looks like the curve at the top of the post, but here it is again:
Here μ is the mean, and σ is the standard deviation of our population. See the ends of this curve way out past 3σ, our 10,000 heads lives way out there somewhere (much further out than three standard deviations I suspect). Now we have what we need to figure out if our observed value is significant or not, but first we need to determine what we consider significant.
This is a whole other issue, but we need to determine how confident we want to be in our conclusions. In different aspects of science we have different levels of acceptable confidence, do we want to be 99.9% sure that our value is an outlier, or do we only need to be 95% certain, maybe we need to be like particle physicists and need five sigma (that would be 5σ or 5 standard deviations away and corresponds to about a 1 in 3.5 million chance that the observed value is an outlier ) to have something significant. Since we are “just” doing a coin flip experiment lets say we want to be 95% sure that our observed value isn’t an outlier. This means that our p-value is less than 0.05, if p-value < 0.05 we say our coin is bias. However, if p > 0.05 then we cannot draw any conclusion (so we accept our null hypothesis that the coin is not bias). It’s important to set our p-value before we get started because we don’t want to be bias ourselves just because we were close. So at the beginning of this exercise I randomly selected 156 heads more than tails in 10,000 flips. I say randomly because I have no idea at this point if that means the coin is bias or not, so let’s do the math and figure it out!
Our mean would be:
(number of trials)(P(heads)) = (10,000)(1/2) = 5000
and the standard deviation can be simplified from above to:
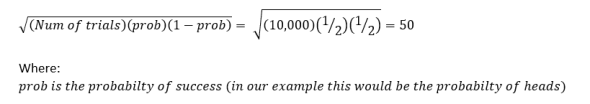
So now we have the expected mean, the standard deviation (σ), our p value ( p = 0.05), and lastly our observed value, which we said was 156 more heads than tails (or 156 away from the mean of what we expected). Now I’m going to take my p-value = 0.05 that we discussed and convert it to z-score. Z-score is just the number of standard deviations away from the mean that we have to be to have significance and there are calculators that will do this online for you, but we can cover both the concepts of p-value and z-score later. In this case a p-value of 0.05 converts to a z-score of 1.96, this means that if our value is greater than 1.96 standard deviations away from our mean we accept our alternate hypothesis (our alternate hypothesis is that our coin is bias). If our observed value is less than 1.96 standard deviations away from our mean, then we accept our null hypothesis (our null hypothesis was that the coin was fair).
Now we can determine our threshold by
μ+(z-score)*(σ) = 5000+1.96*50 = 5098
where μ is our mean, z-score is the z-score we just found, and σ is the standard deviation (from our calculations above). So from that if our observed value is greater than 5098, we have a bias coin. Because 5156 > 5098 we accept our alternate hypothesis, our coin is bias! As it turns out if we do the math using our observed value of 5156, it puts us 3.11 standard deviations away which converting back to p-value means there is only a ~ 1.9% chance that our coin is fair and we just happened to get the result we found.
And there you have it, we’ve determined what significance means in this context! As we’ve seen, significance depends on the amount of confidence you want to have in your data. The higher the confidence level, the harder it is to have a value that is considered “significant.” To illustrate this, if we went back to our explanation of significance we said that particle physicists rely on a 5 sigma confidence level, using that standard, we would have to accept our null hypothesis! This actually let’s us take a momentary break from significance and we can discuss type 1 and type 2 errors! That will be a slightly shorter conversation and I think after these past few days a short post is in order.
So yeah, I probably could have broken this up into a few more posts, but I’m glad we finally solved the mystery of the bias coin. We will go back and tie up some loose ends, such as the p-value and z-score that I glossed over to keep this short. For those of you who hung in there to the end, I hope it was worth it. You my dear readers are why I am doing this, so I hope it helps!
Until next time, don’t stop learning!
*As usual, I make no claim to the accuracy of this information, some of it might be wrong. I’m learning, which is why I’m writing these posts and if you’re reading this then I am assuming you are trying to learn too. My plea to yu is this, if you see something that is not correct, or if you want to expand on something, do it. Let’s learn together!!


But enough about us, what about you?