Problem solved

Everyone go back to what you were doing, nothing to see here! Yesterday I had an existential crisis, one that could’ve derailed my technique and any hopes I had at introducing something new into the world. With it, my PhD dissertation topic, meaning I would be over two years in and I would need to reevaluate my goals. Let’s talk about what happened!
For those of you just joining, yesterday I had discovered a problem with my super secret technique that will revolutionize the WORLD!! Not really, but I really do want to introduce something new into the world and hope it helps people so I’ve been working on what we’re calling my super secret technique for a few years now and things were going smoothly! Everything was green and it all pointed firmly to the fact that I had something new and interesting (please hold your applause until the end).
Unfortunately yesterday I ran a test to see the latency between stimulus onset and signal changes between two spatially distinct parts of the brain. In other words, they were far enough away that if one effects the other, then there would be a delay since the signal has to travel from one spot to the other…. or so I thought.
It turns out I had zero delay. The cross correlation of the signal was super high (>70%!), but the delay was zero and it wasn’t like it was highest at zero and close somewhere else that would make sense, it was non-existent in the range that would make sense, which needless to say made absolutely no sense. There can’t be a zero delay, it’s not physically possible!!!!!!
That was two days ago, yesterday I sat down to figure out what the heck was going on and I tried to make sense of what I was seeing. Surely if every other test was giving me a green light, this should’ve too… but what was going on? Well I did the thing I tell all the people I mentor. I visualized the data.
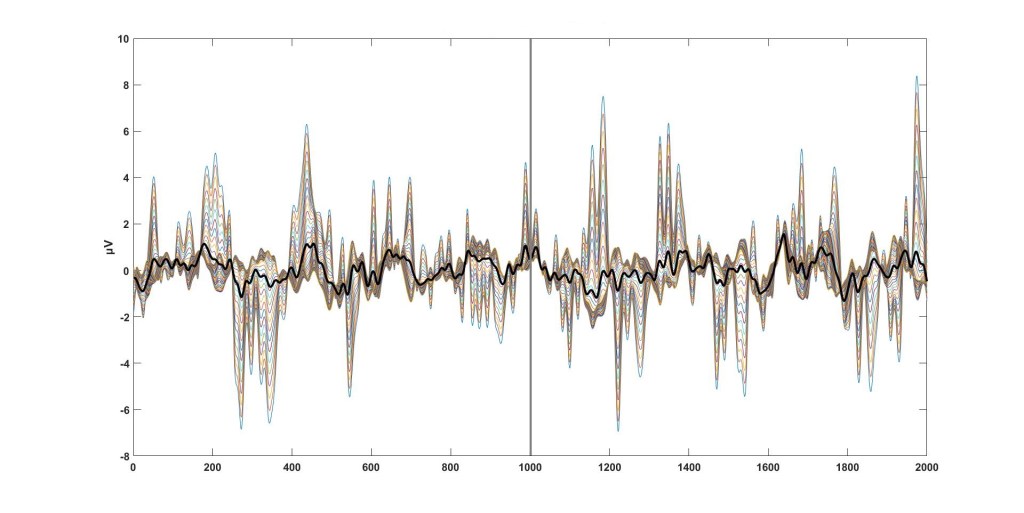
EEG data looks like random squiggles. You can’t really make sense of it in that form, but if we were going to figure out why the computer was giving me the answer it was, I had to SEE the data for myself. The second I plotted it, I figured out what was wrong, easy as that. Sure enough when I fixed it I got an answer that not only made sense, was almost exactly what we would expect it to be for two of the three comparable conditions (I haven’t checked the third yet, but I’m confident I’ll find the same thing).
Now you may be wondering what I saw that gave me the answer, it was the stimulus artifact! The artifact doesn’t travel through the nerves, I mean it does, but the rather large artifact we found spreads fast enough that it looks to be instantaneous (it’s not, but it’s so much faster than the nerve conduction velocity it might as well be). So when I ran the cross correlation of the signals the computer was primarily looking at the artifact, which in comparison to the actual data is orders of magnitude larger, so it made perfect sense.
All I had to do was take my window just after the artifact, once I did that I got a very reasonable output and all it took was less than a minute of typing out the command to plot the data in the window I was looking. Simple fix!
I love that I write these posts daily since it’s a good way to follow along my thought process and see how all this progresses. When we publish results you get to see a nice linear path from start to finish with no real issues along the way. If/when I publish the results from this experiment it will be the same way, you’ll only get to see how I got from point A to B to C and so on. Since we’re doing this semi-real time you get to hear about stuff like this.
The take away for today is simple, when in doubt plot the data. Take a look at what you’re feeding into the computer. Even if you can’t really tell a damn thing from it (like with EEG data), it doesn’t hurt to do a quick check to make sure you’re doing the thing you think you are doing. Trust me, plotting my data has saved me soooo many headaches, like the time I accidentally ran a high-pass filter along the channels axis instead of along the time axis. The output was a beautiful effect, but it was garbage and I wouldn’t have known if I hadn’t plotted it. Seriously, I saved it as a reminder, check it out below…


But enough about us, what about you?