Dissertation data processing

Today is the day! Well one of many days… wait let’s start over. Today we are processing data for my dissertation and by we I mean myself and two people who have been helping me in the school lab. They will be learning how to process the data, but I’ll be processing all my data solo. It’s my dissertation after all and the old saying, “if you want something done right…” applies here. I can’t afford to trust that they will do it correctly because they’ve never done it, but they are going to learn how today!
Technically this meeting was going to happen yesterday. I hate arranging meetings on the weekends because I would rather other people in the lab take the weekend to relax or do other stuff, but my life has been incredibly hectic lately. Between school work and — well work, work — I have had precious little time to myself. In fact, even school stuff has taken a backseat to work stuff, because work stuff is paying the bills. But I’ve managed to fly through my data collection for my dissertation so fast that even school-PI was shocked when he heard I had all my data collected already. But, I want to graduate on time!
Since I’m teaching today, I was going to write out a post on how it all works. How we take raw EEG data and turn it into something usable, or “clean” data. Clean data being EEG without artifacts and minimal noise. We never get a perfect measurement, no matter how close we are to the thing making the signal and EEG in particular is very far away from the thing making the signal (the brain in this case), so we do our best to remove obvious noise and trust that the rest will have particular properties.
Noise in general comes in different “flavors,” most noise I deal with is line noise, which is (in the US) 60 Hz and caused by electrical wires in the walls, lights, technology in general, etc. Basically anything that uses AC current (even if most of that stuff turns the AC current to DC, like computers, laptops, almost everything really). Then there is something called white noise. This is what we consider to be the bulk of the background noise in our recordings.
White noise is “white” because if we converted it to look at the spectral power, it would be a line. That just means that the power at 1 Hz is the same as the power at 100 Hz. You can think of power as amplitude and thankfully white noise has roughly the same amplitude, as in negligibly different across frequencies, so we can account for it in our data. Frankly, we mostly ignore it because its effect at lower frequencies is the same as the effect at higher frequencies.
That doesn’t mean you can’t “see” it, in fact if I create a plot of an event related potential, you can see minor imperfections to a signal that should ostensibly look pretty. Ugh, more explaining, sorry. Event related potentials or ERP are very consistent responses in the brain (in this case) to a stimuli. This can be an electrical stimulus applied to a part of the body or even a flashing light. We typically will take anywhere from 100 to 10,000 of these responses and average them to get the ERP. Since our stimulus is “time locked” meaning we know exactly when we sent it, we can easily get an ERP from the brain.
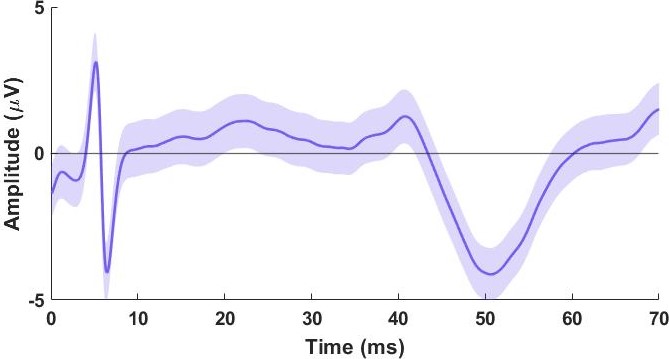
Here’s an example from EEG, which I’ve adjusted to show the stimulus artifact (at time t = 5 ms, that’s an electrical stimulus artifact, it’s small in this case because we were applying it to the foot basically and it was tiny in amplitude to start, but it almost always shows up in EEG recordings) and the peak of the response is at roughly t = 50 ms, we would call that an n1 since it’s our first negative peak. This is the average of 700 stimuli, the data was done for practice so I could teach others how to do this. But you’ll notice that it isn’t a flat line up to the response, it oscillates a little even though it should sit at 0 until the response starts. That’s the effect of white noise and we can’t eliminate it, but the more responses we have, the more we can remove its influence because as we sum the responses to infinity — that is as we collect an infinite number of responses — the sum of white noise is zero because it will (in theory anyway) it will cause just as many positive amplitude changes as negative. Hopefully that makes sense.
The point of today’s exercise is to “pre-process” the data. That just means we’re taking out as much of the noise as we can using different filtering techniques. These take advantage of the properties of certain types of noise, we can remove 60 Hz line noise pretty easily for example because it’s at 60 Hz and to a lesser extent the harmonics (120, 180, …, etc.), but we don’t ever (at least in my labs) go above 100 Hz anyway and most of the time we stay at 50 Hz or so which is already very high frequency for EEG.
There are other algorithms we use to filter out noise though because they all have certain statistical properties we can take advantage of. Much like how we can reduce/remove the influence of white noise by averaging across trials, we can filter out other types of noise as well. Sometimes sensors for example shift causing a movement artifact. Or eye blinks, eye movements, eyes in general, will cause large changes in the data. Eyes are like little batteries in the head and as they move they visibly cause artifacts on the EEG recordings, especially for the sensors that are placed close to the eye.
Teaching this is important for anyone in our lab to learn because it is basically all we do. Going from clean data to visualizing the data is a whole other step, but the first — and arguably the most important — step is cleaning the data. If you don’t have good data you can’t trust your result and learning how to clean your data properly is as much of an art as it is a skill. Part of it is pattern recognition, seeing the raw data and knowing what is an eye blink/movement, what a movement artifact looks like, what a tug on a sensor looks like, understanding that is key because while the algorithms we use to remove all of that do great work, it’s up to you in the end to make sure it’s fully removed or that it worked correctly.
You can apply filters the wrong way. I learned this early on when I tried to apply a low pass filter (meaning we filter anything frequency from the signal that is higher than a cut off, hence we are letting low frequencies “pass” through the filter uneffected) and I applied it the wrong direction. In our work the data are usually organized such that each row is a sensor, but the filter was designed to be applied column wise. The result was beautiful garbage, actually I still have it up on one of my blog posts before I realized it was trash… here (I cropped it from the original to zoom in a bit so you could see what’s going on).
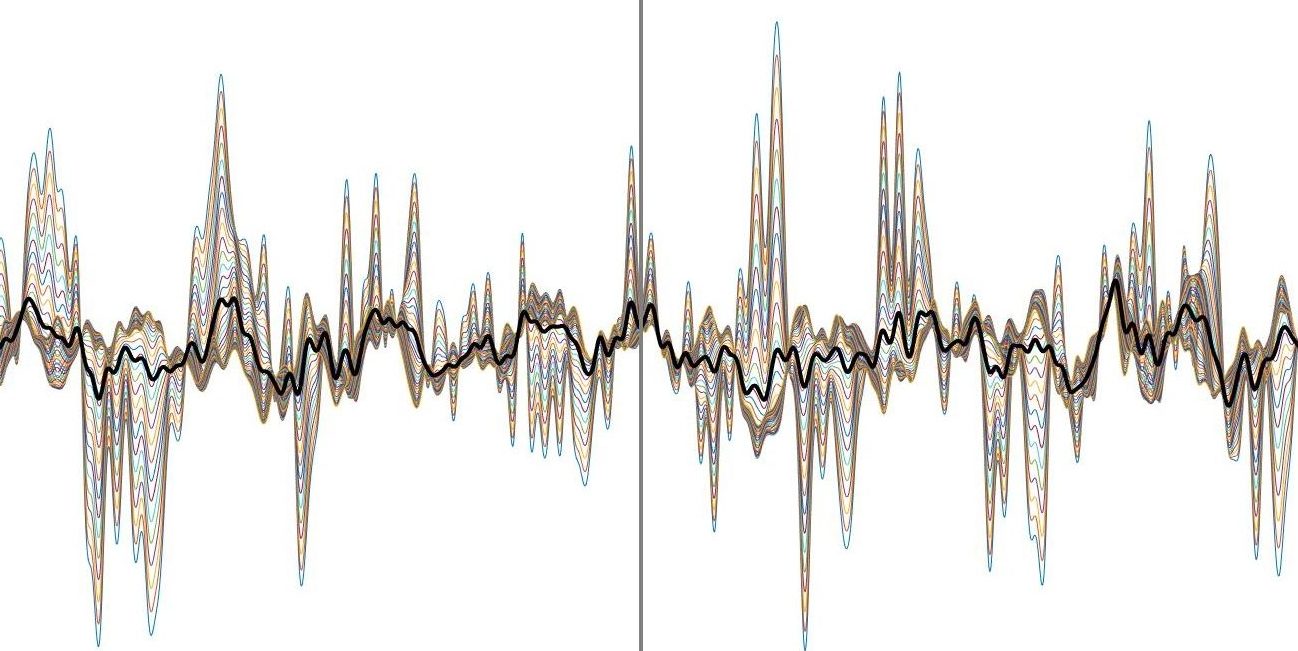
This is 64 channels worth of data and if I didn’t know better, I would say it looks like something. In reality it’s an error caused by the way I filtered the data. I thought it looked wrong at the time, but I had no idea why it looked wrong. It could’ve been right for all I knew and at first I second guessed myself and assumed it was correct. I didn’t know how you could screw up applying a filter to the data. I quickly learned that it was wrong, figured out why it did what it did, and I haven’t made the same mistake again. It’s knowledge like this I aim to pass along today to the people I’m teaching.
I’m hoping to save some of the very real examples from the data I’ve collected today to pass along the knowledge to anyone who wants to learn or just see how it works. No promises, but if all goes well I hope to share all that tomorrow. That is subject to how I feel and how much I get done today, but that’s the goal.
In any case, today we’re dipping our toes into the data I collected and I cannot wait to see if I have something. I really hope I do!


But enough about us, what about you?