Interrogation of spinal networks during movement preparation using transcutaneous spinal stimulation
That’s not the name of the paper, but that’s the general idea. We tend to take movement for granted, I mean most of the time we do it without thinking. I don’t look down as I’m typing these words, yet my fingers know what to do to make it happen. Similarly, we don’t really think about balancing ourselves when we walk, we just do it. So if I’m not consciously thinking about every step I take when I walk down the street, who, or what is keeping me going?
Semi-controversial opinion, but I believe the spinal cord is just a really long brain. It’s made up of the same stuff as the brain and it’s been shown to act independently of the brain. So if it’s made of the the same stuff and thinks for itself, why then do we treat it like a nerve? The answer is, for a long time we didn’t realize the spinal cord did anything besides relay information back and forth. It was the freeway of the body, but that’s no longer the case. More and more we’re realizing just how much the spinal cord does for us, so now we get to poke it with an electrical stick (so to speak) and see what it does.
The idea of the paper was simple, how do we figure out what is going on in the spinal cord when a person wants to move? Well the average human reaction time is anywhere from a (for a human) fast 200 ms up to a slower 300 ms, but most of us will fall in the middle of that distribution despite our best efforts to move faster. And we’ll get into why that’s important in just a minute.
When hospital-PI approached me about this experiment I was amazed that we could indirectly figure out what the spinal networks were doing without invasively poking around in a person’s spinal cord to see first hand (here’s where I said yes to do this paper, spoiler it took far longer than he proposed it would).
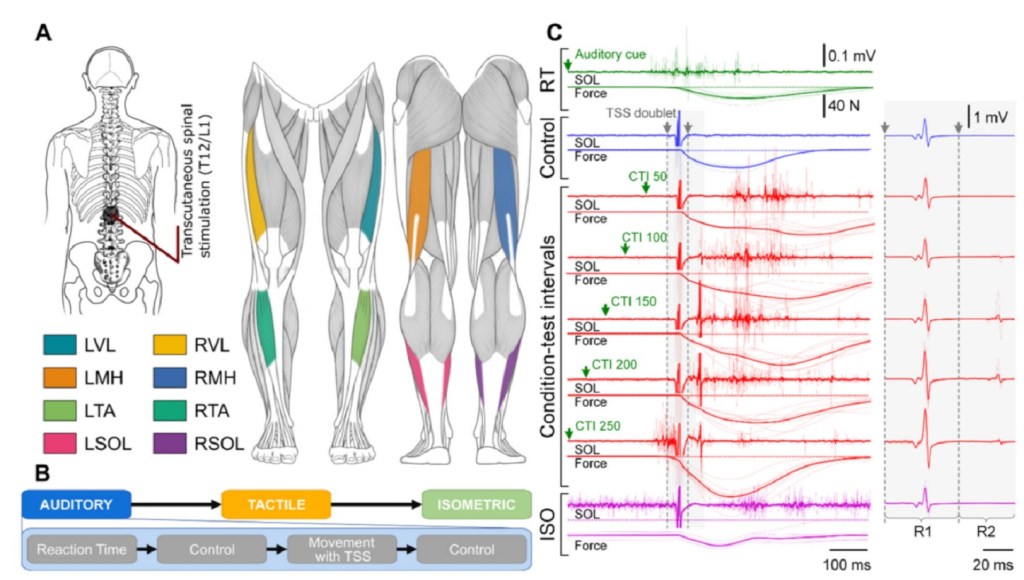
When you move your brain sends signals to networks in the spinal cord. But what does that mean for those networks and how does different movement intentions change what the networks are doing? To answer this question we used transcutaneous spinal cord stimulation (TSS) to see how responses changed PRIOR to movement onset (hence the reaction time comments). We gave our participants either an auditory or tactile cue and they were asked to perform one of four tasks knee flexion, knee extension, plantarflexion (think the motion your ankle makes when you use to step on a gas peddle), or dorsiflexion (pulling the foot back using the ankle, or letting off the gas so to speak).
Now here’s where the magic happens. The brain hears (or the person feels) the cue and when the person tries to move the brain sends signals to the spinal networks responsible for doing those movements. We can figure out what is going on in these networks by applying a electrical stimulus via TSS. Normally, this causes the person’s muscles to flex or causes what we call evoked responses. We’re not 100% sure how TSS works or at least we’re not in agreement, but the idea is that (probably) the electrical current reduces the threshold for neurons to fire. If we lower the threshold far enough the neurons fire and cause the muscle to flex (evoke a response). Measuring that response tells us something about the state of the network because these are dynamic networks so they don’t always require the same amount of stimulus (via TSS or through signals in the body) to fire. A change in the amount required to make a network fire tells us a lot about what’s going on inside the spinal cord without having to peak under the hood.
In fact, it goes both ways. Some networks in the spinal cord will require less stimulus to fire and others will require more. This translates in changes to amplitude of the evoked responses we see when we apply TSS! So the idea in the paper is to ask the person to move as quickly as possible after the cue (remember tactile or auditory) and then we applied TSS at one of several intervals 50, 100, 150, 200, or 250 ms after the cue was given. Since most people don’t actually start moving until close to the 250 ms mark we can determine how the spinal networks are changing based on the responses we record. Oh and in the paper the average response time was 225 ms (ish), which is what we expected to find.
Now that I (hopefully) summarized well enough that you have the needed background we can discuss what we found. But, first thing to note, everything in the paper is scaled to the responses when the person was not moving. Meaning a response of 100% or 1 is what happens when no movement is occurring and we did find some muscles had no real change when movement occurred so we got a ~100% response. However, we would expect to find some muscles facilitated (higher response) and some inhibited (lower response) when a person is moving. More importantly we would expect different results depending on the movement.
What we found was some very cool stuff! Now I’m trying to avoid the technical language of the paper, but that can be hard so apologies if I fail. We found facilitation in the agonist muscles (think agony, or the muscle doing the work) as early as 50 ms after the cue was given! There were some very interesting changes and it was a LOT of data, so to make it easier (or at least more compact) to read I condensed it all into cord diagrams. Figures 3, 5, and 7 in the paper show our mean response across all the participants (13 in total). We repeated the experiment so we had 10 data points for each movement and “CTI” which is the delay between the cue and stimulation, so a lot of data points!

To read the cord diagrams (the auditory cue is shown above), the bottom shows the name of the muscle and the top shows the CTI used (again, delay) the space between two tick marks at the top is scaled to 100% and the thickness of the connection tells you how much of a response we got, so if the “LVL” muscle at CTI 150 was 1 and a half tick marks thick, that means there was a 150% response! So just by looking for the thickest lines you can see the largest changes and trace them back to the muscle and CTI used. Of course we get way more complicated than that, but for the average reader I think the biggest (and easiest) things to look at are my probability maps!
After we had all those data points we could determine the probability of seeing facilitation (a higher response) or inhibition (lower response) for a given movement, CTI and cue (auditory vs. tactile). So if all 1300 or so datapoints had a higher response than our baseline (no movement) then we would have 100% chance of facilitation, if all our data points were below the baseline then we would say we had 100% chance of inhibition. We would expect on average for half to fall above and half to fall below if there were no differences between the condition and baseline, but we had 100% facilitation (and inhibition too, but only for isometric contraction) for several cases.
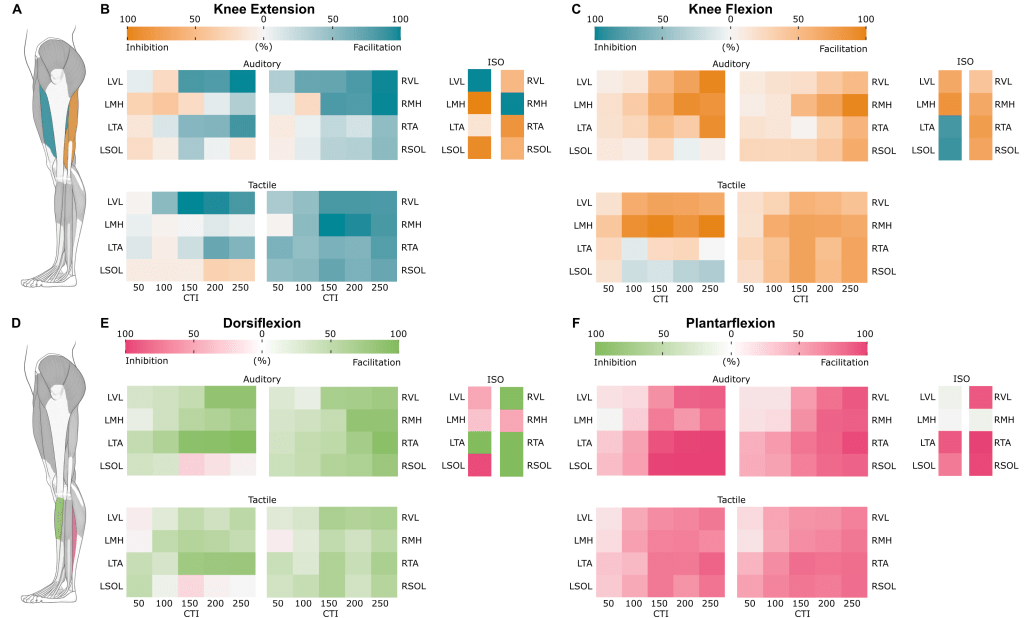
You can see the pattern of excitability change as the movement progresses, or in the case of isometric contraction (where we applied TSS while the movement was done and held) we can see how the “fixed” network looks. Now I’m 98% confident hospital-PI would’ve noticed this (no idea why I’m referring to him as hopital-PI since I’m outing myself for this paper, habit I guess), but I saw an interesting pattern here for all conditions and it happened a bit by luck.
When we perform dorsiflexion (as an example) we’re using our tibialis anterior muscle (shown above in green, LTA) so that is our “agonist” muscle (remember agony, doing work!) the opposite muscle (since muscles come in pairs) is called the antagonist and in this case would the soleus (shown above in pink, LSOL), which should in theory start relax to let the other muscle do its work, if you notice above for the left dorsiflexion (E) both auditory and tactile we the probability tend toward inhibition in the soleus (so we would expect to find a smaller response). This is also seen in the isometric contraction with 100% inhibition (dark pink LSOL)!
We found this type of behavior in both dorsiflexion (E) and knee extension (B). For knee extension the agonist is the LVL (left vastus lateralis, blue) and the antagonist is the LMH (left medial hamstring, orange). Notice the isometric contraction for (B) also has a similar extreme probability of facilitation for the agonist and inhibition for the antagonist. My realization, we don’t see this for plantarflexion and knee flexion! In fact we see there is a probability of co-facilitation! In fact, in the isometric contraction conditions we have almost a 100% chance of co-facilitation.
Since this is getting a little long I’ll wrap it up by saying that our findings suggest that the brain doesn’t excite the motorpools of the spinal cord, insead it downregulates them (makes it easier for them to fire). This means the spinal cord can take control of the movement using information about what the legs are doing in space via for example proprioception, or the ability for you to close your eyes and know where your limbs are without seeing them. Which means your brain doesn’t have to do all the work while you’re walking, it just lets the spinal cord do the driving. Now obviously more research is needed to confirm our findings and this is just a hypothesis based on what we found, but it’s all very exciting, no pun intended!
There was a lot of other implications to the stuff we found, but this was a much longer post than I intended already. Hopefully it makes sense to everyone, particularly those who are not in my field.
Since we believe science should be for the people this paper is open access so you can read the entire thing if you want! This is a little scary for me, but to hell with it: Characterization of Spinal Sensorimotor Network Using Transcutaneous Spinal Stimulation during Voluntary Movement Preparation and Performance
Hello world.


Neeeeeaaat. The fact that you can use stimulation as a measurement tool fascinates me. And you have every right to be proud of those diagrams. I think they get the information across tidily, not to mention they’re very pretty to look at.
I think this blog is the first place I’ve seen the notion of the spinal cord possibly doing processing activities, learning, and being involved in “muscle memory,” rather than just being a signal conduit. The sheer complexity of the brain amazes me, and if even that’s not enough — if it’s offloading some perceptual processing and muscle control to the spinal cord — that would mean we underestimated how much machinery is needed for our intellect, yet again. (When I see people talk about how much computing power might be needed to simulate or replicate human intelligence, including all the sensorimotor aspects, they bring up figures like the average number of neurons or synapses in the brain. I don’t know that I’ve seen anyone account for the spinal cord.)
The explanations here were quite understandable! The only big question I was left with is why, in the example figure, the results for the first and second response look so different. I think I found this in the paper: it’s because the second-response diagrams show the ratio between second and first, rather than the raw values for the second. I assume R1 and R2 refer to the responses to the first and second pulses in the TSS doublet?
Nice work, and congratulations on your second publication.
LikeLiked by 1 person
December 21, 2021 at 12:58 pm
Thank you so much! I agree the figures are pretty awesome. I also drew the muscle diagrams (lower legs front/back/side views). Ironically that was a learning experience all on its own since I’m not used to drawing on a computer.
I think you’re absolutely right that when we talk about the brain and its capabilities it would be wrong not to include the spinal cord in that discussion. To this day I honestly don’t know why the spinal cord was just thought to be a nerve basically, it’s made up of both white and grey matter (although flipped with the white matter on the outside, grey on the inside), it’s basically a tube shaped brain!
So the R1 and R2 stuff, yeah I knew I should’ve explained that, but I didn’t want the post to be even longer! R1 is response 1 and R2 is response 2 so you’re right about that (which bodes well for others who read the paper!).
First, yes the second response figures are the ratio between R2 and R1 (R2/R1) because (and I had a big debate with hospital-PI on this) that was the convention others were using. But there is something more subtle going on and since you asked I can explain here.
When a neuron fires it enters the refractory period, which is a fancy science way of saying the neuron is very unlikely to fire a again for a certain period of time. When we stimulate the spinal cord via TSS we’re basically shotgun blasting the area with electricity to reduce firing threshold (probably, again the mechanisms are debatable). So the most excitable neurons will fire and enter the refractory period.
There are two main nerve roots to the spinal cord the dorsal roots and the ventral roots. Dorsal roots are the ones closest to the surface of the skin (dorsal, back) so biology is working in our favor here because those are the nerves that input into the spinal cord. When we use TSS it’s not the spinal cord we’re stimulating directly (because it’s difficult to do that even with epidural stimulation), but we’re stimulating the dorsal roots because they are very sensitive and those activate the machinery in the cord.
However, not far away are the ventral roots! These send signals from the spinal cord to the muscles/organs/etc. So the dorsal roots are inputs to the spinal cord and ventral roots are the outputs. We don’t want to stimulate the outputs because we want to activate the fancy spinal cord machinery that we can’t easily replicate with direct muscle stimulation (FES), but if we increase the amplitude of stimulation we can stimulate the ventral roots and activate the muscles directly.
The R2/R1 ratio gives us an idea about how much of the ventral roots were being activated because the R2 stimulus should (in theory) be mostly/all ventral root activation. This also gives us some information about how sensitive those pathways become and we’re using the R2/R1 ratio to demonstrate that. (Side note I forgot to mention, everything in the chord diagrams is statistically significant, the non-significant muscle responses are not shown to make it easier for the reader to see the actually important things, so even without knowing how to read it exactly, you can see just how much “stuff” changes).
And that is why we use the TSS doublet instead of single pulses!
LikeLiked by 1 person
December 22, 2021 at 10:09 am
Wait, you drew all those muscles too? I’m impressed.
Thanks for the added explanations! I wasn’t sure why you were doing two pulses, so that’s quite useful to know.
LikeLiked by 1 person
December 22, 2021 at 10:39 am
Yep I did draw them, so thank you! Don’t be too impressed though, I used some old anatomy images for the outlines/proportions then found a textured brush that looked like muscles, so it was mostly the computer doing the work.
I’m glad the explanation made sense! I was afraid it would just confuse people if I added it into the main post.
LikeLiked by 1 person
December 22, 2021 at 12:16 pm