Day 2: Power Spectral Density (pmtm)
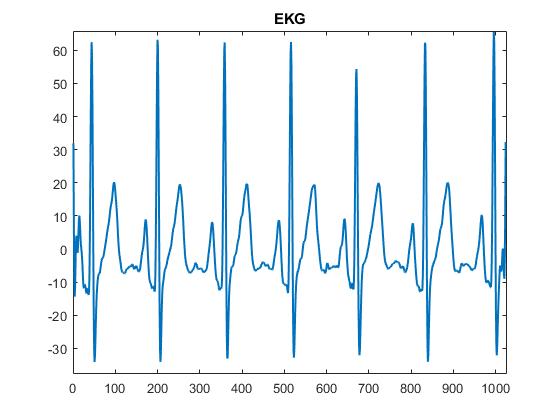
A example EKG signal
This is a (somewhat) continuation on what we were discussing in the previous post. We covered the pwelch MATLAB function, this time we will cover the PMTM function, this function uses the Thomson multitaper method to calculate power spectral density. We can do a deep dive into the differences between the two next time, but for now let’s talk about the command itself.*

Power spectral density estimate of the EKG data shown at the top of the post using the Thomson multitaper method (note this was prior to filtering the line noise out, so we have a huge 60Hz spike caused by line noise here but not in our example EKG signal, I did this so it actually looks like an EKG signal and not a squiggly mess)
[pxx,f] = pmtm(x,nw,f,fs)
As you may have guessed already, the MATLAB commands are very similar, so they are going to have similar inputs and outputs. The major difference at this stage is the nw input, but we will go over all the inputs for completeness.
Inputs:
- x like pwelch, x is your input signal (in our example above this would be the EKG signal at the top of the post.
- nw, this is the Time-half bandwidth product, this will change the main lobe size (we will cover what that means later). The important takeaway is the higher the value, the smoother the plot, however it comes at a cost. As you increase the value you lose the ability to localize the frequency (which is one of the reasons why the plots look smoother)
- f, this is again a repeat, you can specify the frequencies you want to focus on, the input looks like [10 500] and needs to be at LEAST two elements long.
- fs, this is the sampled rate of the signal (you should know this… right?), if you do not use this then your output frequencies would be normalized (like we talked about last post)
Outputs:
- pxx, this is your output from the transform (or your y-values),
- f, this is your frequency vector.
So this is just a basic bit about what your options are for inputs and what you can expect from outputs. Should you use this or pwelch by simply calling the function (without all the stuff before the equals sign) MATLAB will automatically generate a plot of your output. Now before I end this, why not see a bit of a preview of the next post. Here is the power spectral density estimate of the EKG signal at the top of the post using pmtm, just like you saw before we discussed the function (left) and power spectral density estimate of the same EKG signal, but this time using pwelch (right).


See the differences? Well we will talk about what creates those differences and what you can (and cannot do) about them next time. If I’m going to write daily, it will be best if I pace myself, so stay tuned!
*As usual, I make no claim to the accuracy of this, I’m learning, you’re learning. If you see something that is not correct, or heck if you want to expand on something, please do! Let’s learn together.


But enough about us, what about you?