Day 9: Reading a Spectrogram

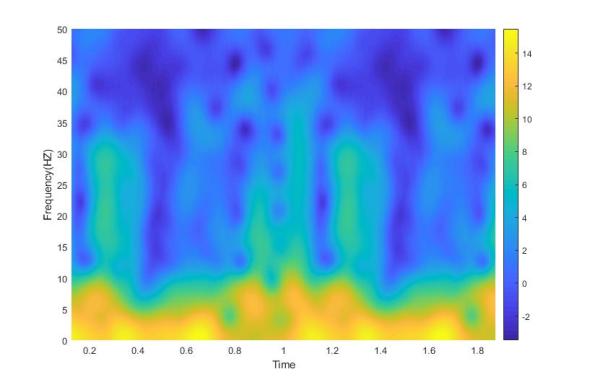
Definitely not the same spectrogram as yesterday, no really look. Now for the part where I tell you how to read this thing…
Last post we introduced a new tool in our arsenal of signal processing analysis, the spectrogram. Without knowing how to read it, it just looks sort of like a colored mess. Don’t get me wrong, it is an interesting looking colored mess, but a mess nonetheless. Well today we are going to talk about how to interpret the plot and why exactly we would ever use this seeming monstrosity.*


