Day 6: The fast and the Fourier
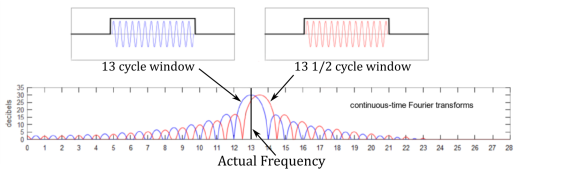
A good example of how the Fourier transform can approximate signals. The red signal is our input signal and the blue shows how the output of the Fourier transform.
Okay, if you’ve been keeping up with these posts, we know about Welch’s method, Thomson’s method, the things that make them different, and the things that make them similar. The thing that both of these transforms rely on is the Fourier transform. What is the Fourier transform? Well, something I probably should have covered first, but whatever this is my blog we do it in whatever order we feel like, so let’s dive in!*
Day 5: Whose window function is it anyway?


This is not how we use a window function on the computer…
One day someone looked at the windowed fourier transform and said, “Don’t be such a square!” and thus window functions were invented. If you believe that, then I have an island for sale, real cheap. But seriously, let’s do a dive into what a window function is and why the heck there are so many of them, because there ARE a LOT! So let’s get started!*
Day 4: Spectral leakage… embarrassing

Look at that leakage!
Leakage, it’s never a good thing. For today’s post we’re going to cover a very important topic. Spectral leakage, it’s a big reason why spectral density estimation is well, an estimation. The other reason it is an estimation is because the fourier transform is an approximation of the original signal, but the Fourier transform is a whole other post on its own. So let’s talk leakage!*
Day 3: Power Spectral Density Overview


In our last post we introduced the two main characters in this story of spectrogram. On one end we have Welch’s method (pwelch) on the other end we have the Thomson multitaper method (pmtm). As promised here is a awful basic breakdown of why is more than one way to compute power spectral density (in fact there are several, far more than the two I’m talking about). So, let’s just dig right in!*
Day 2: Power Spectral Density (pmtm)

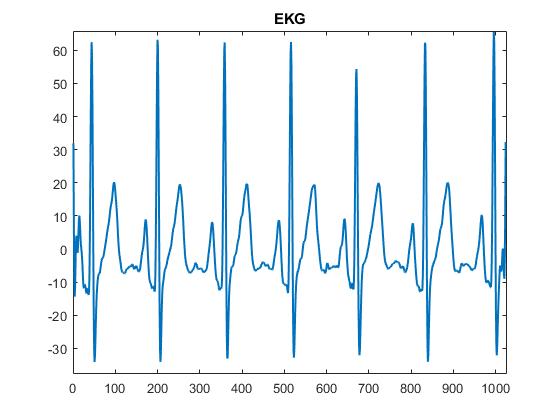
A example EKG signal
This is a (somewhat) continuation on what we were discussing in the previous post. We covered the pwelch MATLAB function, this time we will cover the PMTM function, this function uses the Thomson multitaper method to calculate power spectral density. We can do a deep dive into the differences between the two next time, but for now let’s talk about the command itself.*
Day 1: Power Spectral Density (pwelch)
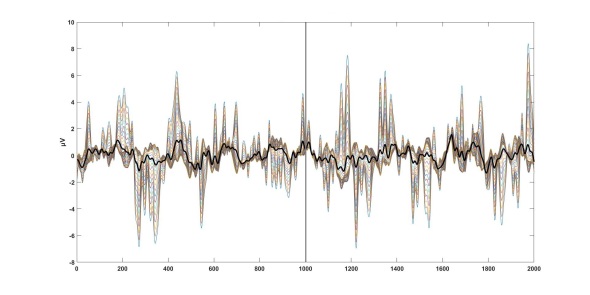
Some EEG data that I’ve aligned, processed, and made look nice and pretty.
Signal processing, it’s complex, there are a million ways to go about processing a signal, and like life, there is no best way to go about doing it. Trust me, it is as frustrating as it sounds. Today’s scratch pad note is on power spectral density or PSD for short. So let’s dive in.*


