Day 11: Why even use the spectrogram?
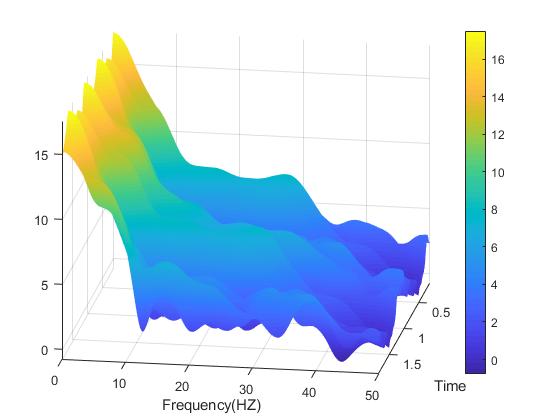
A spectrogram plot rotated so we can see all three dimensions.
So you wanna use a spectrogram… but why? What does a spectrogram do that we can’t do using some other methods for signal processing? As it turns out, there is a lot of reasons you may want to use the spectrogram and today we are going to cover some of those reasons and number four may shock you! (okay not really, what do you think this is a clickbait website?)*
We’ve come to the big question when it comes to the spectrogram, why do we use this thing? The answer is really simple if you already know, but it may not be so obvious for someone just starting out (like myself!). So we already know that we can use the spectrogram to see power changes at certain frequencies over time. The question then becomes why is this useful? One very particular answer is that if our events are not time locked, then averaging those events will obscure the actual output. Let’s talk about what exactly that means by first showing the result of averaging spikes that are not time locked like the ones on the left below.
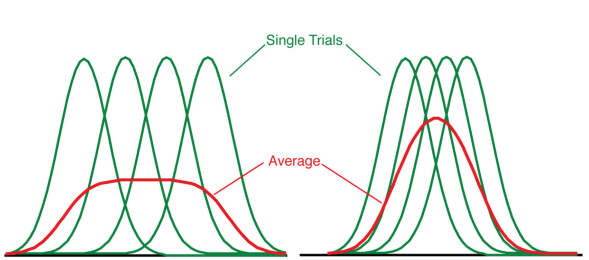
Using an ensemble average of several trials that are not time locked will cause smoothing of the pulses, a large variance (left) will cause a significant change in the averaged power than the power of an averaged signal that has less variance across trials.
Now, if we look above we can see that averaging across trials doesn’t always have the effect we want. If the stimulus you are interested in (this could be EEG recordings, EMG recordings, basically any recording that you may have several trials) is not time locked or perfectly aligned then when you average them you will lose the actual amplitude and really just flatten the signal you may be interested in.
To overcome the shortcoming of averaging this way, we can use the spectrogram to see changes in power of the signal (the amplitude) over time across trials. This means your data doesn’t need to be time locked exactly for you to extract information based on the signal. This is also why we don’t typically average across trials then take the spectrogram, we would take the average across spectrograms instead. While there are other good reasons to use the spectrogram plot, maybe you just want a different way to visualize the data. This keeps getting mentioned, but it is also a good way to see how the overall power of the signal changes over time and across frequencies, which means we can see all three dimensions of the signal in a way that is easier to interpret.
I’m sure there are other very good reasons to use the spectrogram, but frankly in the work I’m doing, the specific reason has to do with averaging across trials. We can discuss why we average across trials and maybe we should take it back a few notches and discuss how we collect signals and introduce the concept of signal and noise explicitly instead of making assumptions. I guess I’ve got plenty to think about for the next post now…
Until next time, don’t stop learning!
*If you’ve read any of my posts you know this already, but I make no claim to the accuracy of this information, some of it might be wrong. I’m learning, which is why I’m doing this. If you’re reading this then you are probably trying to learn too. If you see something that is not correct, or if you want to expand on something, please do it. Let’s learn together!!


But enough about us, what about you?