Process the data!
It’s a process… that’s for sure. So you’re a scientist and you collect a ton of data, well now what? We’re talking about me of course. I did it, I collected a ton of data and now I need to do something useful with it. This is the part I wish I could skip over and get to the part where I get all the cool results, but I guess we’ve all got to start somewhere.
Today it’s time to hit the caffeine hard then process some data! It’s not that bad to be honest, it was just a learning curve the first time I did it, soIT. TOOK. FOREVER. Like months, it was bad. I hated it. Although now that I have a lot of my code written, created a rough pipeline for everything, and generally have an idea of how to proceed I’m hopeful it will be a smooth week or so of work to get something interesting.
Here’s the tricky part though, I’m working in two labs, both have their own ways of doing things. So not only do I need to do my data processing both ways, I need to explain the results from the second method to my Co-PI because I don’t know that he would understand how to make sense of it because he’s never worked in a brain-machine interfacing lab and they do things completely different than how he is used to doing it.
It all comes down to the frequency domain. A weird place where anything is possible. By anything I mean me screwing something up. But seriously, working with results in the frequency domain is a lot different than working with data in the time domain.
In the time domain we can look at amplitudes of responses. This is suuuuuper easy to do. I love it. I’ve processed so much data for this lab using that method and it takes maybe an hour per subject. Not only that, but the software we use makes it so easy all I have to do is select the portion of the response I’m interested and copy then paste. Super easy!!
The frequency domain works in power in decibels (dB) and looks at the frequency of the signal which can be a little (a lot) confusing. It’s not as intuitive as working with time and amplitudes. So there WILL be some explaining involved to help my Co-PI understand my results.
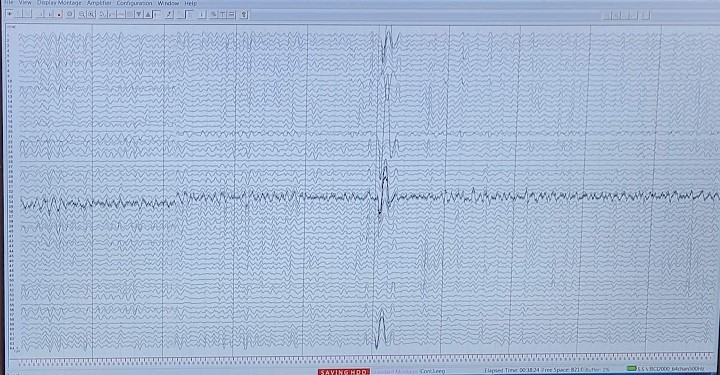
Now I have 64-channels of EEG data and we record at 1000 hz (or 1000 samples per SECOND!) Our experiment lasts about an hour plus setup where the system is recording so let’s say I have an hour and 15 minutes of data per subject. That is roughly 288,000,000 samples per subject. That’s a lot of data.
I could theoretically visualize all of it and try to pull out the parts I want, but to make things easier, I added “flags” to the data to tell me where the interesting parts happened. I search for those flags and pull out the data before and after the flag for each flag. There are roughly 300 flags in my data per subject, so again it’s a lot, but having these notes in the data make it easier to separate out what I want.
But wait there’s more! You can’t just go grab the stuff you are interested in, first you need to clean your data. Noise is everywhere, when we use EEG systems, we have to deal with it somehow, so we filter out super low frequency (0.01 hz) noise, line noise (which is caused literally by electrical lines and in the US is 60 hz), and muscular artifacts, eye movement/ eye blink artifacts, and a bunch of other things that make your data look like complete garbage.
That is the hard part in all of this, there isn’t exactly a single way to do that. You can actually get very in depth in cleaning data and while I have my own little pipeline I use, others may do things far differently. We have things like independent component analysis, or dipole clustering, or dipole fitting, which are all special techniques to tease out the things we are interested in.
These are automated though… to a point. It requires a lot of visual inspection to make sure that things “look” right before you move on. You can actually start removing useful signal if you’re not careful or you may not remove enough of the noise if you don’t check while you’re cleaning. So you can actually spend a lot of time just staring at plots and changing variables slightly to see what works better.
So today I get to plot things, watch my computer do a lot of work, change a variable and repeat the process until I am satisfied that my data is as noise free as I can get it before I can start doing any serious analysis. How long are we talking? Well it could be days, it could be a week, but I’m hopeful it will be on the shorter end. It’s just been a while since I’ve worked with raw data like this, so it’s going to take me a minute to remember the steps.
With that, I have ~288,000,000 data points to sort though, wish me luck!


But enough about us, what about you?